


American Airlines Group Inc AAL and Southwest Airlines Co LUV reversed course on Thursday after selling off for months amid fear over rising COVID-19 Delta variant cases.
Bullish investors seem to have largely left the travel sector over worries subsequent waves of the virus could bring back strict travel restrictions or lockdowns.
If American Airlines and Southwest can demonstrate Friday’s bullish moves are more than a "dead-cat" bounce that might be set to change.
See Also: If You Invested $1,000 In Southwest Airlines Stock One Year Ago, Here's How Much You'd Have Now
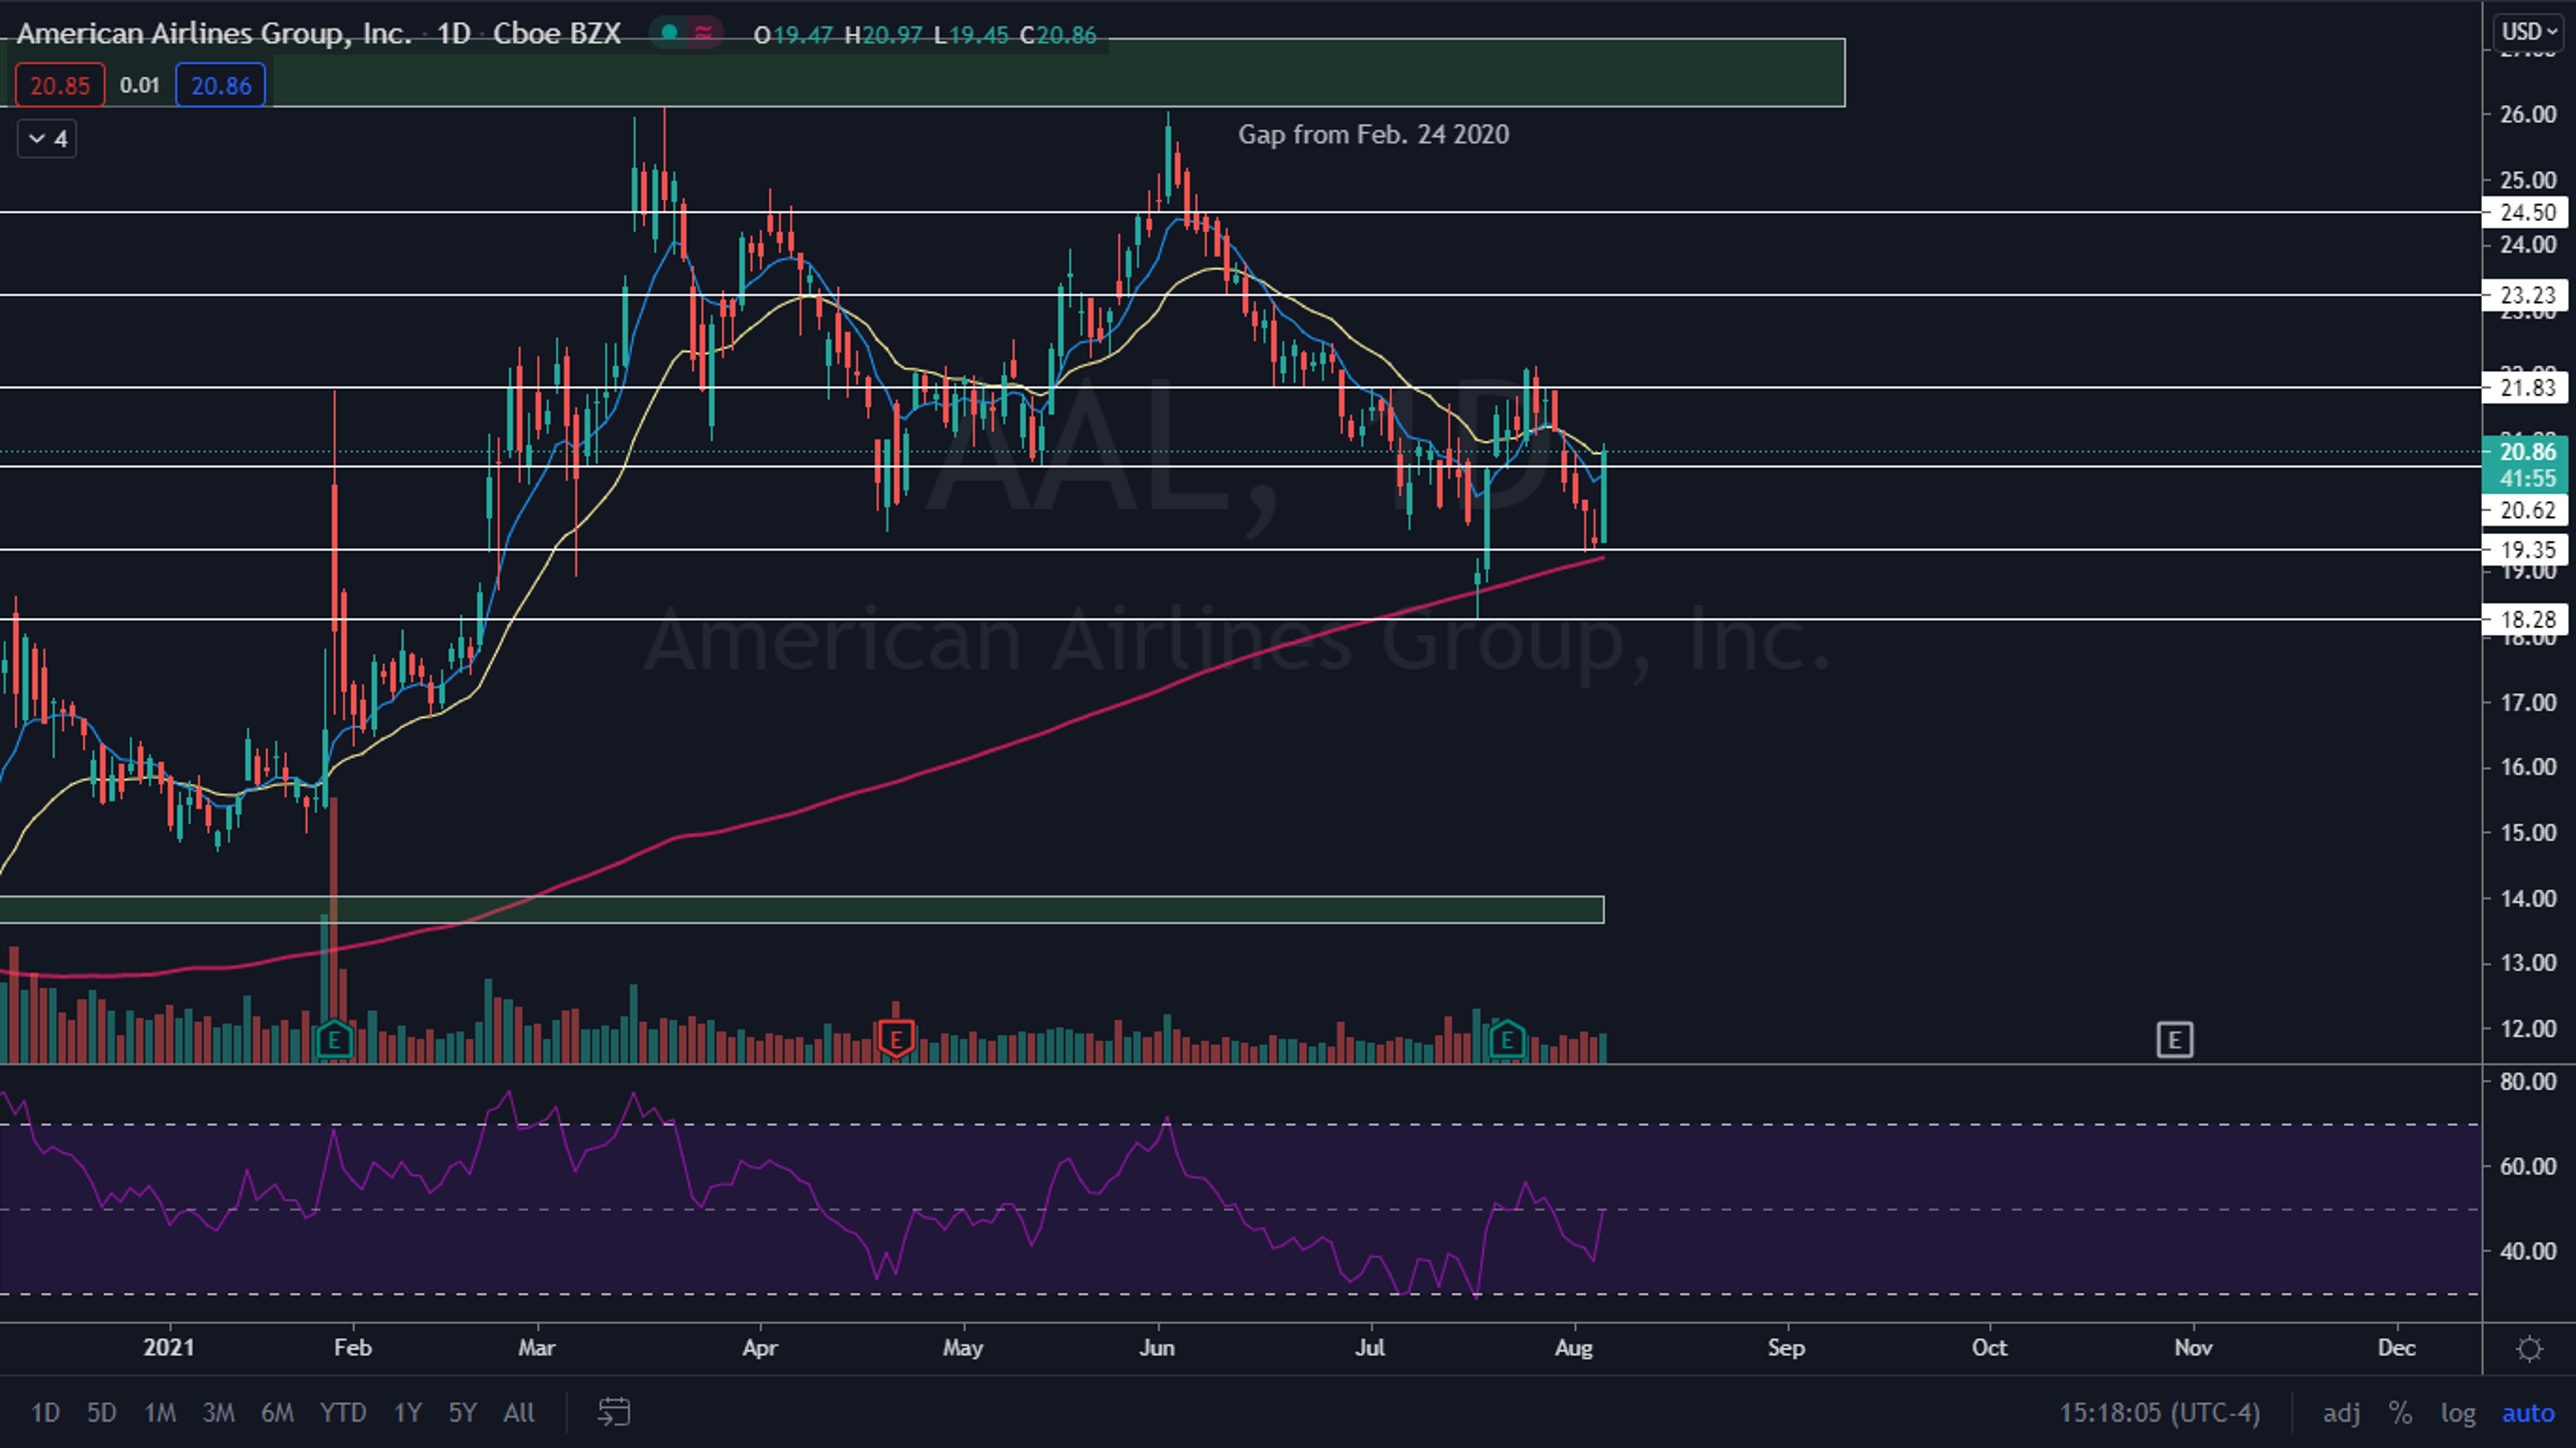
The American Airlines Chart: American Airlines hit a support level Thursday (July 29) at $19.35 and on Friday (July 30) bounced up over 7%. The bounce caused the stock to print a bullish Marubozu candlestick indicating higher prices are likely to come on Friday (Aug. 6).
The move north had high volume and by midafternoon 31.98 million shares of American Airlines had traded hands compared to its 10-day average of 28.36. The high volume also indicates high prices will come.
It is bullish when a stock moves north on high volume and south on low volume, while bearish traders prefer to see a security move higher on low volume and drop on high volume.
American Airlines is trading above the eight-day exponential moving average (EMA) and in line with the 21-day EMA. Bulls will want to see the stock regain the 21-day EMA as support for the eight-day to eventually cross above the 21-day which would then be bullish. American Airlines is trading above the 200-day simple moving average (SMA) which indicates overall sentiment is bullish.
Bulls want to see continued momentum on Friday (Aug. 6) for American Airline’s stock to move up towards a higher resistance level at $21.83. If it can regain the level of support it has room to fly up toward the $23.23 level.
Bears want to see the stock reject the 21-day EMA and for selling pressure to drop American Airlines back under support at the $20.62 mark. If the stock loses the area as support it could retrace toward $19.35.

The Southwest Chart: On July 21, Southwest popped up over a descending trendline that had been holding it down since June 3, but the stock didn’t get a bullish follow-through.
Since then, Southwest continued its downtrend but the trendline became support and the stock has held above it.
On Thursday (Aug. 5), bullish volume came into Southwest’s stock and drove it up over 3%. The stock then slammed into a resistance level near the $50.65 level, rejected and wicked from it.
Unlike American Airlines, Southwest’s volume is not indicative of higher prices and on Thursday afternoon (Aug. 5) 4.96 million shares of the stock had traded compared to a 10-day average of 6.94.
Bulls will want to see increasing volume to feel confident on a move higher over the coming days.
Southwest is trading in line with the eight-day EMA and below the 21-day EMA with the eight-day EMA trending below the 21-day EMA, which is bearish. Southwest is also trading below the 200-day SMA.
Bulls want to see increasing bullish volume pop Southwest up over resistance at $50.65. If the stock can regain the level as support it has room to move up toward the $52.53 level.
Bears want to see Southwest’s stock continue to reject the upper resistance level and for the stock to close the eight-day EMA. If Southwest can’t regain the upper level as support it could retrace toward the descending trendline once again.

© 2024 Benzinga.com. Benzinga does not provide investment advice. All rights reserved.
Trade confidently with insights and alerts from analyst ratings, free reports and breaking news that affects the stocks you care about.

