


Like stocks, cryptocurrency is cyclical. Bitcoin BTC/USD, Ethereum ETH/USD and numerous altcoins have been running in a bull market for months.
What’s different about this bull cycle is that most cryptocurrencies have made big bullish moves in unison as opposed to a trickle-down cycle of money moving first to Bitcoin and Ethereum before moving into altcoins.
There is much excitement and anticipation leading up to this weekend when, Technoking of Tesla Inc TSLA and Imperator of Mars, Elon Musk will host "Saturday Night Live." Dogecoin may be a little unpredictable going into Musk’s performance, especially considering the massive 1,100% run it’s made over the past 30 days and lack of technical support.
Bitcoin and Ethereum, on the contrary, shouldn’t be affected by Musk’s verbiage and have bullish-looking charts going into the weekend.
See Also: How to Buy Bitcoin (BTC)
The Bitcoin Chart: On Friday afternoon Bitcoin bust through resistance at the $57,657 mark and was printing a bullish engulfing candlestick on the daily chart. Bitcoin has been consolidating since making a new all-time high of $64,899 on April 14 but in consolidation set up a bullish inverted head-and-shoulders pattern that could prompt a bullish reaction into the weekend.
Bitcoin is trading above both the eight-day and 21-day exponential moving averages (EMAs), with the eight-day EMA trending above the 21-day EMA, both of which are bullish indicators. Bitcoin is also trading above the 200-day simple moving average (SMA) which indicates overall sentiment in the cryptocurrency remains bullish.

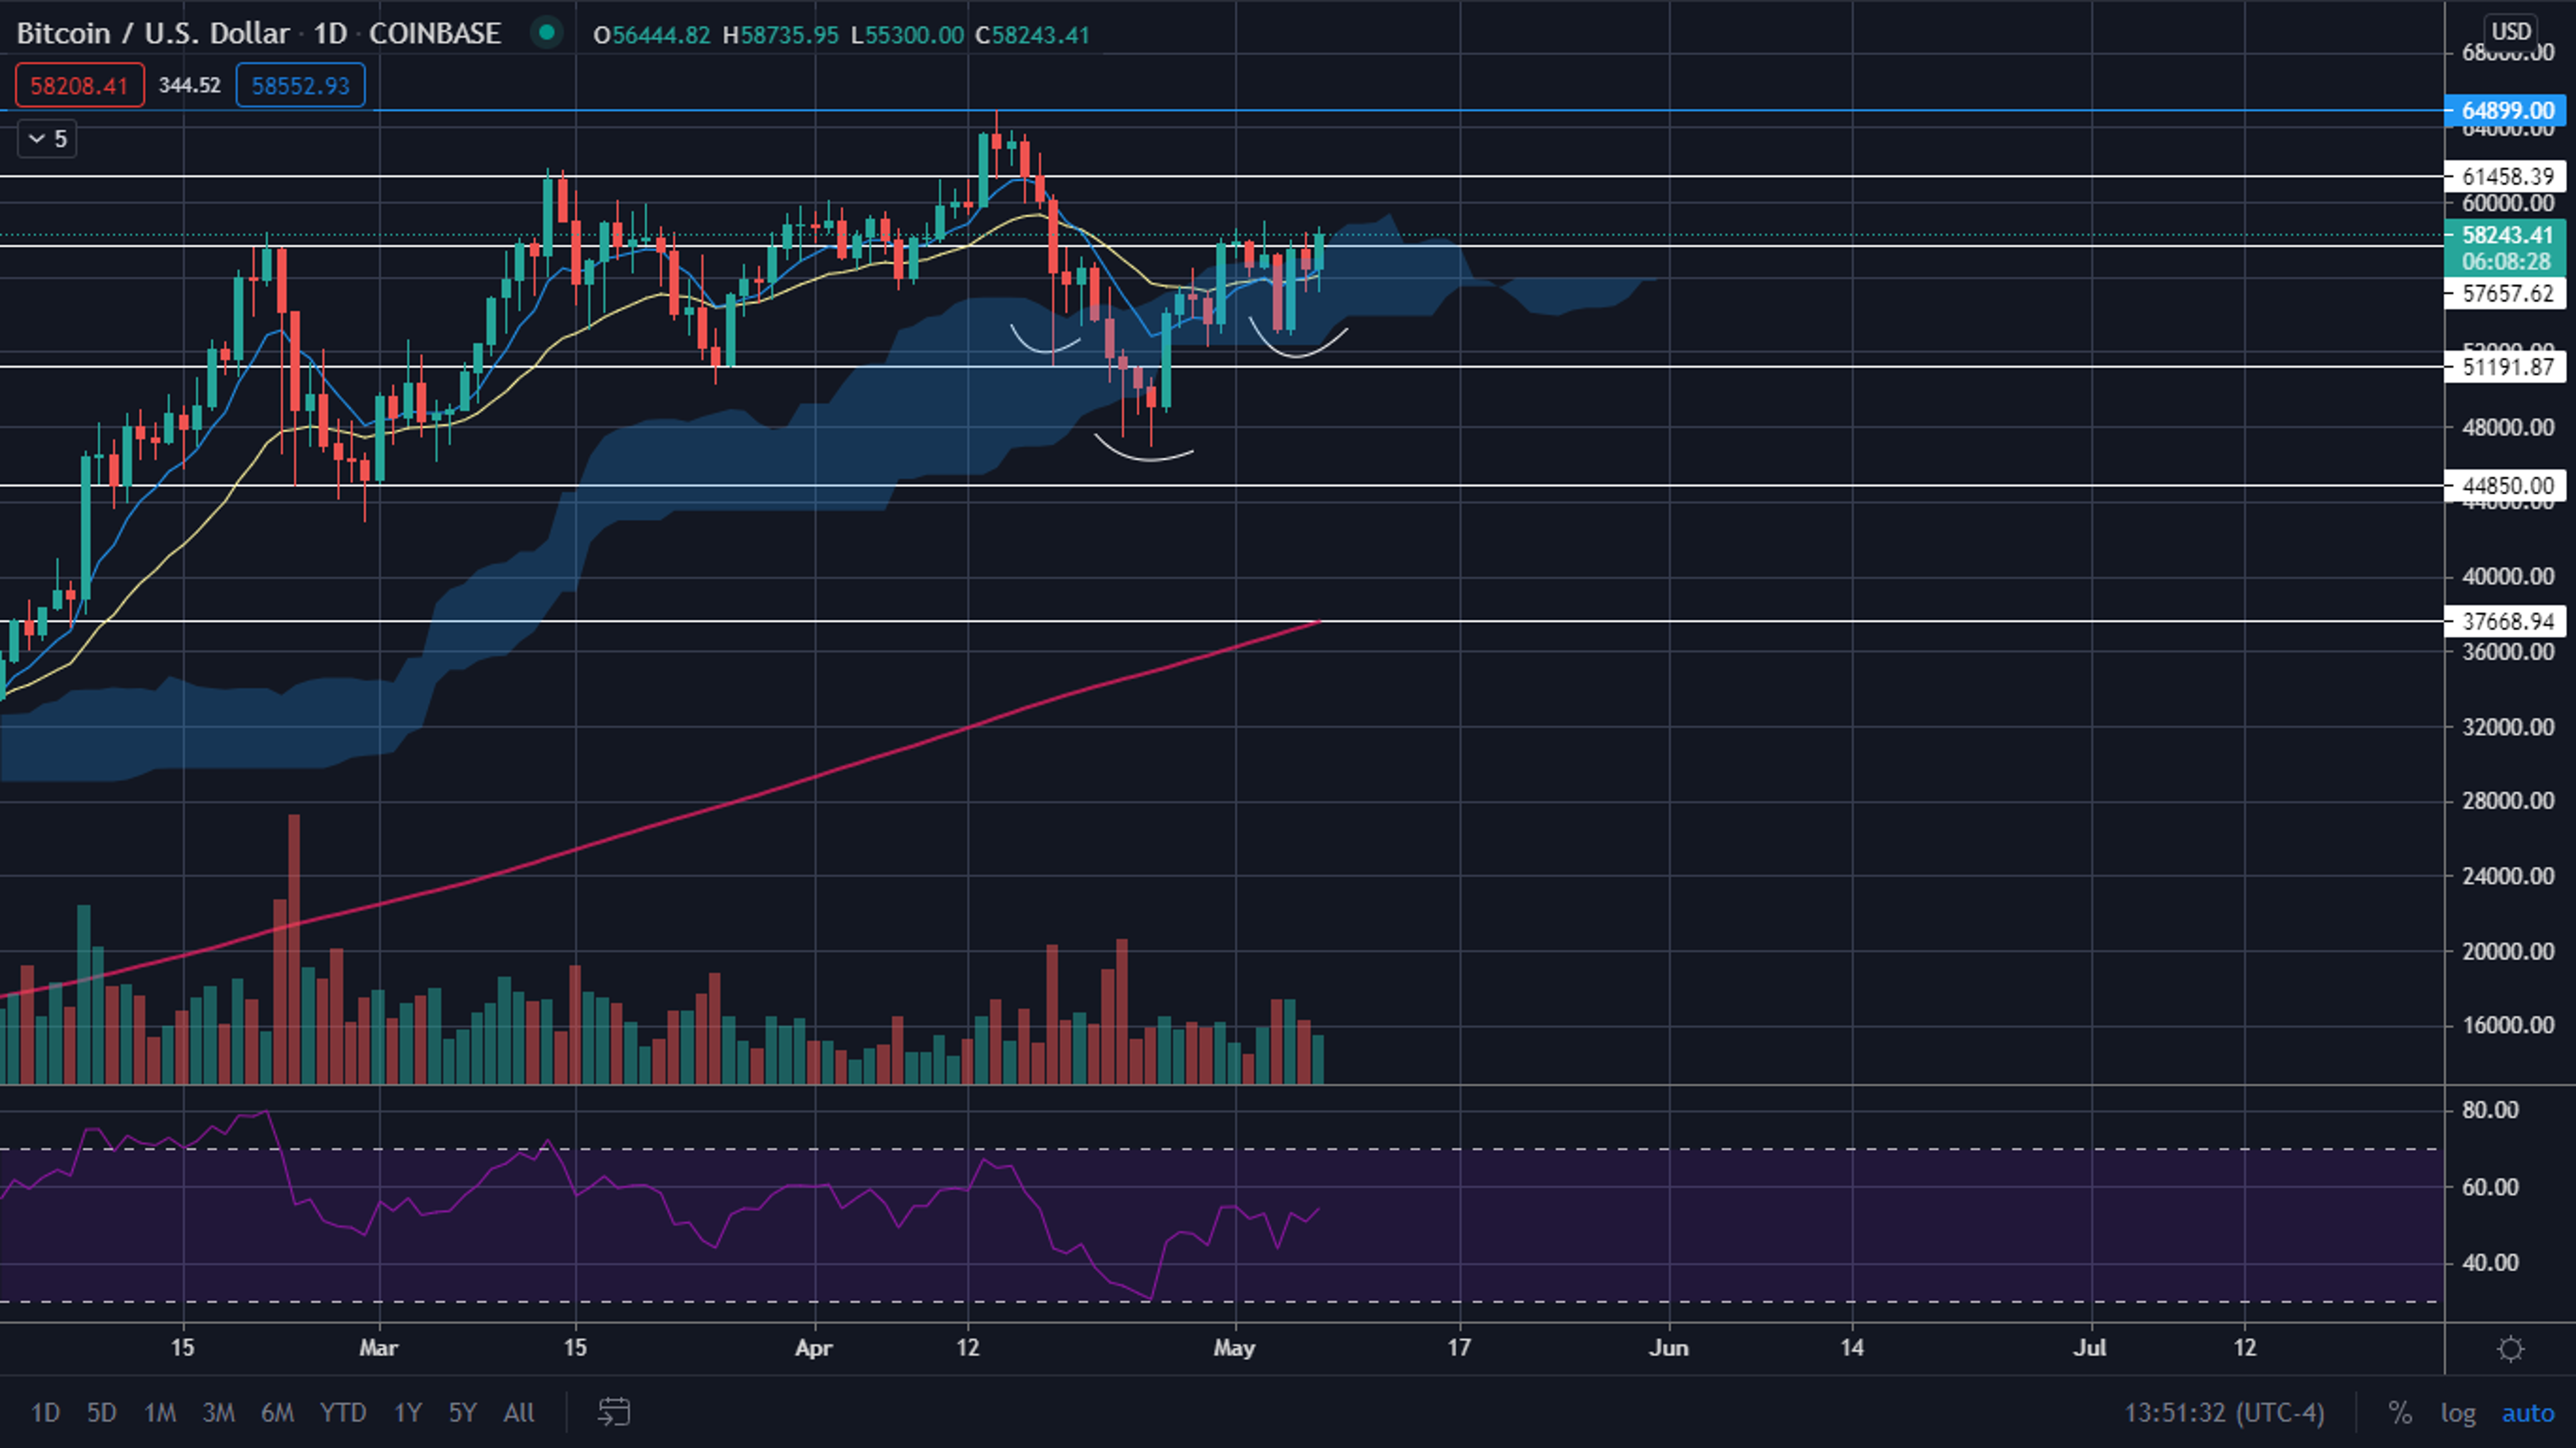
Bulls want to see Bitcoin hold and close the day above the $57,650 area for a run back towards its next resistance at $61,458. If Bitcoin can regain that level as support it can freely move back towards all-time highs. If Bitcoin can make a new all-time high, with bullish continuation volume, it has no resistance in the form of price history above.
Bears want to see the daily candle close under Bitcoin’s support at $57,657 so that level, once again, becomes resistance. If the bears can sustain bearish pressure Bitcoin could revisit the $51,191 before another possible bounce.
Related content: Bitcoin vs Ethereum
The Ethereum Chart: Ethereum made a new all-time high of $3,610.91 on Thursday and made another run at it on Friday. As of mid-afternoon on Friday Ethereum was printing a bullish green hammer candlestick on the daily chart.
Ethereum is up over 75% over the past 14 days and has not had enough consolidation to give it a lot of support and resistance levels to go off near all-time highs. Bulls will want to see some consolidation on the four-hour or daily chart in the future to set up distinct levels.
Ethereum is trading above both the eight-day EMA, the 21-day EMA and the 200-day SMA, which are all bullish.
Ethereum’s relative strength index is also running a little high at just under 76%. Some daily consolidation would help to drop that number below, a more comfortable, 70%.

Bulls want to see Ethereum pop over Thursday’s high to avoid creating a bearish double top pattern. Like Bitcoin, if Ethereum can make a new all-time high on bullish volume it has no price history resistances above.
Bears want to see bearish volume into Ethereum to drop it down towards $2,776. If Ethereum was unable to hold that level of support it could retrace to the $2,426 mark before landing on another support level.
See Also: How to Buy Ethereum (ETH)
© 2024 Benzinga.com. Benzinga does not provide investment advice. All rights reserved.
Trade confidently with insights and alerts from analyst ratings, free reports and breaking news that affects the stocks you care about.

