


AMSTERDAM, Jan. 27, 2021 /PRNewswire/ -- Core Laboratories N.V. (NYSE: "CLB US" and Euronext Amsterdam: "CLB NA") ("Core", "Core Lab", or the "Company") reported that continuing operations resulted in fourth quarter 2020 revenue of $113,700,000. Core's operating income was $23,400,000, with earnings per diluted share ("EPS") of $0.31, all in accordance with U.S. generally accepted accounting principles ("GAAP"). The financial results for the fourth quarter of 2020 include a non-cash adjustment of $11.9 million to reverse previously recognized stock compensation expense associated with performance share awards that did not fully vest and were revalued. Operating income, ex-items, a non-GAAP financial measure, was $13,000,000, yielding operating margins of 11% and EPS, ex-items, of $0.18. A full reconciliation of non-GAAP financial measures and year-over-year comparisons are included in the attached financial tables.
Core's CEO, Larry Bruno stated, "Core's fourth quarter results demonstrate the dedicated efforts of our innovative staff, the durability and adaptability of the business model, as well as the benefits of the cost reduction plans that were quickly enacted earlier this year. Despite the challenges encountered in 2020, after adjusting for non-cash impairments, Core generated sector-leading operating margins, four consecutive quarters of positive earnings, and positive free cash flow for 2020. This performance enabled the Company to reduce net debt by $48,700,000 throughout the year, while continuing to fund capital investments for growth initiatives. As we embark on 2021, Core remains well-positioned to navigate today's challenging market and capitalize on future growth opportunities, while providing innovative solutions that drive efficiency and reservoir optimization for our clients."
Liquidity, Free Cash Flow, Private Placement Notes and Dividend
Core continues to focus and generate free cash flow ("FCF"), a non-GAAP financial measure defined as cash from operations less capital expenditures. For the full year of 2020 cash from operations was $57,900,000 and capital expenditures were $11,900,000, yielding FCF of $ 46,000,000, marking the 19th consecutive year in which the Company has generated positive free cash flow. Cash flow from operations, for the fourth quarter of 2020, included cash payments unique to the quarter, and had a negative impact on operational cash flow. These cash payments included (i) $16 million for employee post-retirement deferred compensation distributions and employment separation payments and (ii) approximately $5 million for prepaid 2021 corporate insurance programs, which resulted in lower annual premium costs. Accounting for the $21 million in cash payments ($16 million + $5 million), cash from operations was ($2,900,000) for the fourth quarter of 2020, and together with $3,300,000 in capital expenditures, FCF was ($6,200,000). Although these cash payments for employee post-retirement benefits in the fourth quarter are required to be deducted from operational cash flow and FCF, the Company had partially funded the employee post-retirement payments with $11,500,000 of cash received through previously purchased company owned life insurance ("COLI") policies. The cash received from COLI is considered investing activities, and thus, is not included in cash generated from operations or FCF. The following table summarizes the impact of these cash payments on operational cash flow.
Quarter ended December 31, 2020 (in $ millions) | ||
Net cash provided by operations, before employee post-retirement and prepaid insurance payments | $ 18.1 | |
Cash payments for employee post-retirement and prepaid insurance | $ (21.0) | |
U.S. GAAP – net cash used by operations | $ (2.9) | |
Capital Expenditures | $ (3.3) | |
FCF | $ (6.2) |
For the full year, free cash was used to reduce the Company's outstanding debt, and net debt was decreased by $48,700,000 or 16.5%. Core will continue applying its excess free cash flow towards debt reduction for the foreseeable future.
The following graph summarizes the maximum leverage ratio permitted over the relevant period:

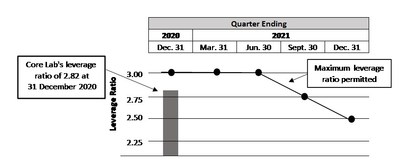
As of 31 December 2020, Core Lab's leverage ratio was 2.82, with $101,000,000 of excess capacity under the Company's revolving credit facility. As previously disclosed, subsequent to year-end, on 12 January 2021, the Company issued $60 million of senior unsecured notes in a private placement transaction. Proceeds from the sale were exclusively used to reduce outstanding borrowings under the credit facility. The Company anticipates it will continue to generate positive cash flow and reduce net debt, while maintaining ample liquidity and remaining in compliance with debt covenants.
On 17 December 2020, Core announced the launch of an "at-the-market offering" for the issuance and sale of up to $60.0 million of common shares. Core Lab intends to use the net proceeds from the sale of Shares, if any, for general corporate purposes, which may include, among other things, investments in the development of new products and technologies, capital expenditures, repayments of indebtedness, working capital and potential acquisitions. The Company has not sold shares under this program as of 27 January 2021.
The following table summarizes the quarterly cash dividends paid by the Company for the year ended 31 December 2020. Dutch withholding tax was deducted from each dividend at a rate of 15%.
Quarter Ending |
Record Date |
Payment Date | $ Amount per |
31 March 2020 | 24 January 2020 | 14 February 2020 | $0.25 |
30 June 2020 | 8 May 2020 | 19 May 2020 | $0.01 |
30 September 2020 | 27 July 2020 | 10 August 2020 | $0.01 |
31 December 2020 | 26 October 2020 | 17 November 2020 | $0.01 |
2020 Total | $0.28 |
On 15 January 2021, the Board announced a quarterly cash dividend of $0.01 per share of common stock, payable on 16 February 2021 to shareholders of record on 25 January 2021. Dutch withholding tax will be deducted from the dividend at a rate of 15%.
Reservoir Description
Reservoir Description revenue in the fourth quarter of 2020 was $83,800,000, up 5% sequentially. Operating income for the fourth quarter of 2020 on a GAAP basis was $19,400,000, while operating income, ex-items, was $12,300,000, up 5% sequentially, yielding operating margins, ex-items, of 15%, which were flat sequentially. Sequential performance was associated with improved U.S. client activity and some improvement on longer-cycle international project activity. Operating margins were impacted by continued COVID-19 disruptions that included project and logistical delays in various international markets; however, the implemented cost controls in the segment helped mitigate the impact on operating margins.
During the fourth quarter of 2020, Core continued to perform highly specialized core and reservoir fluid analytical programs on samples originating from the offshore South Atlantic Margin. Additional opportunities along the South Atlantic Margin are unfolding. Several international oil companies have obtained licenses for pre-salt exploration and appraisal in Brazil, signaling that this region will be a focus of near, mid and long-term capital deployment. To support current and future programs, Core is in the final stages of commissioning a new facility in Rio de Janeiro. This laboratory will offer a wide range of testing capabilities, including many of the proprietary and patented technologies that are in high demand throughout Core's global client base. These proprietary offerings include Core's full visualization, pressure-volume-temperature ("PVT") cell instrumentation and Core's Dual Energy CT rock evaluation technologies. This new laboratory secures Core's position as the leading provider of advanced reservoir description services in the region and satisfies the growing demand for Core's patented and proprietary laboratory technologies in this growing market.
Also, in the fourth quarter of 2020, Core continued analytical programs on a variety of CO2 injection projects for both carbon capture and sequestration ("CCS") and for enhanced oil recovery ("EOR") efforts. Under the direction of The CarbonNet Project, Core continued its laboratory analysis of conventional core from the Gular-1 appraisal well, offshore southeast Australia. Data generated by Core is providing insight into seal capacity, storage capacity, geomechanical properties and the pore system properties of the target injection zones. Additionally, in the fourth quarter of 2020, Core was engaged by a national oil company in the Asia-Pacific region to evaluate CO2 injection opportunities as part of an EOR program in tight oil reservoirs. Core Lab combined its proprietary high frequency nuclear magnetic resonance technology with physical laboratory core flooding experiments to determine in-situ hydrocarbon saturations during and after CO2 injection. This comprehensive dataset is providing the operator with an understanding of fluid displacement and fluid interactions throughout the CO2 flooding process. For these EOR applications, CO2 purity, injection parameters, fluid compatibility, and rock properties all need to be measured and evaluated. These two projects are representative of the various CO2 subsurface injection opportunities that exist for Core and its clients.
Production Enhancement
Production Enhancement operations, which are focused on complex completions in unconventional, tight-oil reservoirs in the U.S., as well as conventional offshore projects across the globe, posted fourth quarter 2020 revenue of $29,900,000, up 18% sequentially. The revenue increase was primarily driven by U.S. land energetic product sales, which improved 65%, sequentially. This compares very favorably with sequential U.S. land well completion activity. Operating income on a GAAP basis was $4,500,000, and $1,170,000 ex-items, both up sequentially. Additionally, operating margins improved sequentially from near break-even to 4% for the quarter.
Core's clients are always seeking innovative technological solutions to optimize their completion techniques. Recently, several of Core's technologically sophisticated clients in North America pursued an oriented downhole perforating technology which would align the perforations in the direction of maximum principal stress. To meet this objective, Core's Production Enhancement engineering team developed the patent pending Oriented GoGun™. Providing both very high alignment accuracy and wellsite efficiency, this technological advancement is designed to allow the frac energy to be focused in a manner that maximizes the frac while minimizing tortuosity. Core's Oriented GoGun™ also eliminates the need for orientation subassemblies, minimizing the number of connections and saving time by not having to recapture and redress orienting subs. During the fourth quarter of 2020, one of the largest E&P operators in North America conducted field trials, including various offerings from competitor's oriented systems. During the field trails, downhole cameras were used by the operator to verify orientation accuracy. Core Lab's Oriented GoGunTM proved to have the highest level of accuracy, both from perforation to perforation and from stage to stage. As a result of Core's superior product performance, the operator has adopted the Oriented GoGun™ as their preferred perforating system.
Also, during the fourth quarter of 2020, Core's proprietary completion diagnostic services were utilized in a major Gulf Coast natural gas storage project. Core was engaged by the operator to assess the effectiveness of frac pack completions performed on a number of wells in this gas storage field. Core utilized its PackScan® density logging technology to determine the competency of the annular packs that had been placed in these wells. In one of the wells, Core's PackScan® density log revealed insufficient coverage of the perforated interval and a completely uncovered sand control screen. Core's engineers identified these potential failure points and recommended a proppant "top-off" treatment to remediate the interval of concern. The operator agreed, and within a week a successful "top-off" treatment was performed, resulting in 14 feet of proppant coverage above the top of the sand control screen. It is critical that these gas storage wells be effectively fracked and the annulus competently packed in order to ensure their long-term functionality for both injecting and withdrawing natural gas. Core Labs' PackScan® technology and the resultant top-off treatment avoided a costly completion remediation program.
Return On Invested Capital
Core's Board of Supervisory Directors ("Board") and the Company's Executive Management continue to focus on strategies that maximize return on invested capital ("ROIC") and FCF, factors that have high correlation to total shareholder return. Core's commitment to an asset-light business model and disciplined capital stewardship promote capital efficiency and are designed to produce more predictable and superior long-term ROIC.
Events associated with the COVID-19 pandemic have caused significant disruptions in global markets and economies, with adverse effects throughout the energy sector. These adverse effects have triggered significant asset impairments for goodwill, intangible assets, inventory and other fixed assets, which further distort underlying financial performance and performance metrics, such as ROIC.
The Board has established an internal performance metric of demonstrating superior ROIC performance relative to the oilfield service companies listed as Core's Comp Group by Bloomberg. In 2020, Core Lab recorded $133 million in non-cash charges associated with impairment of goodwill, intangible assets and inventory. Excluding these adjustments, Core's calculation of ROIC using Bloomberg's formula was 4.7%.
Industry and Core Lab Outlook
For 2021, Core will continue to focus on executing its strategic plan of generating free cash and reducing net debt, while maximizing ROIC. Additionally, as part of the Company's 2021 strategic focus, the Company will continue to invest in targeted, client-driven technologies that aim to both solve client problems and capitalize on Core's growth opportunities.
Core is optimistic about its international growth opportunities as the second half of 2021 unfolds and COVID-19 disruptions are expected to abate. With Core Lab having more than 70% of its revenue exposed to international activity, the Company remains active on international projects already underway. International markets are expected to drive growth opportunities for the Company in the second half of 2021 and beyond; these areas include: Brazil, Mexico, Qatar and various other areas of the Middle East. Unpredictable project and logistical disruptions related to COVID-19 are expected to persist in the near to mid-term. For the first quarter of 2021, and consistent with historical trends, Core Lab expects lower client activity due to seasonality. This seasonal pattern typically results in a decline in first quarter revenue by mid-single digits. Core anticipates typical seasonal effects and COVID-19 restrictions to impact the first quarter of 2021, with first quarter revenue projected to be flat to down by low single digits, sequentially. The projected decline in first quarter revenue is slightly less pronounced, compared to historical trends, as the Company expects momentum in U.S. land activity to continue.
Within Reservoir Description, Core expects reservoir fluid analysis, which accounts for more than 65% of the segment's revenue, to remain resilient as this work is diversified across the life of the reservoir and less reliant on drilling and completion of new wells. However, given Reservoir Description's strong international exposure, COVID-19 disruptions present uncertainties for near to mid-term client activity levels as travel restrictions fluctuate due to virus trends.
Core sees continued, gradual sequential improvement in U.S. land activity into 2021. As a result, Core Lab projects Production Enhancement first quarter 2021 revenue to increase sequentially. Core expects Production Enhancement to continue to track or outperform activity levels in U.S. land completions.
In summary, despite the near-term international challenges related to COVID-19 restrictions, Core Lab sees activity levels improving as 2021 unfolds, with higher incremental margins emerging in the second half of the year. Core's growth opportunities are directly related to expanding client activity and new market penetration, particularly internationally. Within that context, Core remains focused on the on-going development of new client driven technologies and market penetration, as well as the continued focus on digitization and automation throughout Core's business.
The Company's first quarter 2021 guidance is based on projections for the underlying operations and exclude gains and losses in foreign exchange. This initial first quarter 2021 guidance also assumes an effective tax rate of 20%.
Earnings Call Scheduled
The Company has scheduled a conference call to discuss Core's fourth quarter 2020 earnings announcement. The call will begin at 7:30 a.m. CST / 2:30 p.m. CET on Thursday, 28 January 2021. To listen to the call, please go to Core's website at www.corelab.com.
Core Laboratories N.V. is a leading provider of proprietary and patented reservoir description and production enhancement services and products used to optimize petroleum reservoir performance. The Company has over 70 offices in more than 50 countries and is located in every major oil-producing province in the world. This release, as well as other statements we make, includes forward-looking statements regarding the future revenue, profitability, business strategies and developments of the Company made in reliance upon the safe harbor provisions of Federal securities law. The Company's outlook is subject to various important cautionary factors, including risks and uncertainties related to the oil and natural gas industry, business conditions, international markets, international political climates, public health crises, such as the COVID-19 pandemic, and any related actions taken by businesses and governments, and other factors as more fully described in the Company's most recent Forms 10-K, 10-Q and 8-K filed with or furnished to the U.S. Securities and Exchange Commission. These important factors could cause the Company's actual results to differ materially from those described in these forward-looking statements. Such statements are based on current expectations of the Company's performance and are subject to a variety of factors, some of which are not under the control of the Company. Because the information herein is based solely on data currently available, and because it is subject to change as a result of changes in conditions over which the Company has no control or influence, such forward-looking statements should not be viewed as assurance regarding the Company's future performance. The Company undertakes no obligation to publicly update or revise any forward-looking statement to reflect events or circumstances that may arise after the date of this press release, except as required by law.
Visit the Company's website at www.corelab.com. Connect with Core Lab on Facebook, LinkedIn and YouTube.
CORE LABORATORIES N.V. & SUBSIDIARIES CONDENSED CONSOLIDATED STATEMENTS OF OPERATIONS (amounts in thousands, except per share data) (Unaudited) | |||||||||||||||||||||
Three Months Ended | % Variance | ||||||||||||||||||||
December 31, | September 30, | December 31, | vs. Q3-20 | vs. Q4-19 | |||||||||||||||||
REVENUE | $ | 113,749 | $ | 105,382 | $ | 156,778 | 7.9% | (27.4)% | |||||||||||||
OPERATING EXPENSES: | |||||||||||||||||||||
Costs of services and sales | 87,918 | 81,038 | 117,749 | 8.5% | (25.3)% | ||||||||||||||||
General and administrative expenses 1 | (3,692) | 8,937 | 9,773 | NM | NM | ||||||||||||||||
Depreciation and amortization | 4,837 | 5,164 | 5,535 | (6.3)% | (12.6)% | ||||||||||||||||
Inventory write-down | 443 | — | — | NM | NM | ||||||||||||||||
Other (income) expense, net | 839 | (1,088) | 2,666 | NM | (12.6)% | ||||||||||||||||
Total operating expenses | 90,345 | 94,051 | 135,723 | (3.9)% | (33.4)% | ||||||||||||||||
OPERATING INCOME | 23,404 | 11,331 | 21,055 | 106.5% | 11.2% | ||||||||||||||||
Interest expense | 2,920 | 4,672 | 3,588 | (37.5)% | (18.6)% | ||||||||||||||||
Income from continuing operations before income tax expense | 20,484 | 6,659 | 17,467 | 207.6% | 17.3% | ||||||||||||||||
Income tax expense | 6,540 | 3,663 | 7,177 | 78.5% | (8.9)% | ||||||||||||||||
Income from continuing operations | 13,944 | 2,996 | 10,290 | 365.4% | 35.5% | ||||||||||||||||
Income (loss) from discontinued operations, net of income taxes | (424) | — | — | NM | NM | ||||||||||||||||
Net income | 13,520 | 2,996 | 10,290 | 351.3% | 31.4% | ||||||||||||||||
Net income attributable to non- controlling interest | (17) | 33 | (40) | NM | NM | ||||||||||||||||
Net income attributable to Core Laboratories N.V. | $ | 13,537 | $ | 2,963 | $ | 10,330 | 356.9% | 31.0% | |||||||||||||
Diluted EPS from continuing operations | $ | 0.31 | $ | 0.07 | $ | 0.23 | 342.9% | 34.8% | |||||||||||||
Diluted EPS attributable to Core Laboratories N.V. | $ | 0.30 | $ | 0.07 | $ | 0.23 | 328.6% | 30.4% | |||||||||||||
Weighted average diluted common shares outstanding | 44,958 | 44,899 | 44,634 | 0.1% | 0.7% | ||||||||||||||||
Effective tax rate | 32 | % | 55 | % | 41 | % | NM | NM | |||||||||||||
SEGMENT INFORMATION: | |||||||||||||||||||||
Revenue: | |||||||||||||||||||||
Reservoir Description | $ | 83,838 | $ | 80,060 | $ | 102,617 | 4.7% | (18.3)% | |||||||||||||
Production Enhancement | 29,911 | 25,322 | 54,161 | 18.1% | (44.8)% | ||||||||||||||||
Total | $ | 113,749 | $ | 105,382 | $ | 156,778 | 7.9% | (27.4)% | |||||||||||||
Operating income: | |||||||||||||||||||||
Reservoir Description | $ | 19,426 | $ | 11,022 | $ | 14,248 | 76.2% | 36.3% | |||||||||||||
Production Enhancement | 4,495 | (321) | 6,586 | NM | (31.7)% | ||||||||||||||||
Corporate and Other | (517) | 630 | 221 | NM | NM | ||||||||||||||||
Total | $ | 23,404 | $ | 11,331 | $ | 21,055 | 106.5% | 11.2% | |||||||||||||
"NM" means not meaningful | |||||||||||||||||||||
(1) For the quarter ending December 31, 2020, General and administrative expenses include an adjustment to reverse $11.3 million of stock compensation that had been previously recognized. | |||||||||||||||||||||
CORE LABORATORIES N.V. & SUBSIDIARIES CONDENSED CONSOLIDATED STATEMENTS OF OPERATIONS (amounts in thousands, except per share data) (Unaudited) | |||||||||||||
Twelve Months ended | % Variance | ||||||||||||
December 31, 2020 | December 31, 2019 | ||||||||||||
REVENUE | $ | 487,267 | $ | 668,210 | (27.1)% | ||||||||
OPERATING EXPENSES: | |||||||||||||
Costs of services and sales | 374,767 | 495,579 | (24.4)% | ||||||||||
General and administrative expenses | 34,033 | 48,023 | (29.1)% | ||||||||||
Depreciation and amortization | 20,867 | 22,605 | (7.7)% | ||||||||||
Impairments and other charges | 122,204 | — | NM | ||||||||||
Inventory write-down | 10,375 | — | NM | ||||||||||
Other (income) expense, net | 1,826 | 5,319 | NM | ||||||||||
Total operating expenses | 564,072 | 571,526 | (1.3)% | ||||||||||
OPERATING INCOME (LOSS) | (76,805) | 96,684 | NM | ||||||||||
Interest expense | 14,372 | 14,690 | (2.2)% | ||||||||||
Income (loss) from continuing operations before income tax expense | (91,177) | 81,994 | NM | ||||||||||
Income tax expense (benefit) | 5,896 | (12,290) | NM | ||||||||||
Income (loss) from continuing operations | (97,073) | 94,284 | NM | ||||||||||
Income (loss) from discontinued operations, net of income taxes | (424) | 7,833 | NM | ||||||||||
Net income (loss) | (97,497) | 102,117 | NM | ||||||||||
Net income attributable to non-controlling interest | 140 | 134 | NM | ||||||||||
Net income (loss) attributable to Core Laboratories N.V. | $ | (97,637) | $ | 101,983 | (195.7)% | ||||||||
Diluted EPS from continuing operations | $ | (2.18) | $ | 2.11 | NM | ||||||||
Diluted EPS attributable to Core Laboratories N.V. | $ | (2.20) | $ | 2.28 | NM | ||||||||
Weighted average diluted common shares outstanding | 44,477 | 44,646 | (0.4)% | ||||||||||
Effective tax rate | (6) | % | (15) | % | NM | ||||||||
SEGMENT INFORMATION: | |||||||||||||
Revenue: | |||||||||||||
Reservoir Description | $ | 355,041 | $ | 420,897 | (15.6)% | ||||||||
Production Enhancement | 132,226 | 247,313 | (46.5)% | ||||||||||
Total | $ | 487,267 | $ | 668,210 | (27.1)% | ||||||||
Operating income (loss): | |||||||||||||
Reservoir Description | $ | 55,044 | $ | 55,140 | (0.2)% | ||||||||
Production Enhancement | (133,449) | $ | 38,378 | NM | |||||||||
Corporate and Other | 1,600 | 3,166 | NM | ||||||||||
Total | $ | (76,805) | $ | 96,684 | NM | ||||||||
"NM" means not meaningful | |||||||||||||
CORE LABORATORIES N.V. & SUBSIDIARIES CONDENSED CONSOLIDATED BALANCE SHEET (amounts in thousands) (Unaudited) | |||||||||||||||||||||
% Variance | |||||||||||||||||||||
ASSETS: | December 31, | September 30, | December 31, 2019 | vs. Q3-20 | vs. Q4-19 | ||||||||||||||||
Cash and cash equivalents | $ | 13,806 | $ | 15,146 | $ | 11,092 | (8.8)% | 24.5% | |||||||||||||
Accounts receivable, net | 83,192 | 85,366 | 131,579 | (2.5)% | (36.8)% | ||||||||||||||||
Inventory | 38,151 | 42,908 | 50,163 | (11.1)% | (23.9)% | ||||||||||||||||
Other current assets | 30,699 | 26,469 | 28,403 | 16.0% | 8.1% | ||||||||||||||||
Total Current Assets | 165,848 | 169,889 | 221,237 | (2.4)% | (25.0)% | ||||||||||||||||
Property, plant and equipment, net | 115,293 | 117,123 | 123,506 | (1.6)% | (6.6)% | ||||||||||||||||
Right-of-use assets | 66,385 | 69,228 | 75,697 | (4.1)% | (12.3)% | ||||||||||||||||
Intangibles, goodwill and other long-term assets, net | 221,053 | 234,574 | 354,233 | (5.8)% | (37.6)% | ||||||||||||||||
Total assets | $ | 568,579 | $ | 590,814 | $ | 774,673 | (3.8)% | (26.6)% | |||||||||||||
LIABILITIES AND EQUITY: | |||||||||||||||||||||
Current maturities of long-term debt | $ | — | $ | 75,000 | $ | — | NM | NM | |||||||||||||
Accounts payable | 23,028 | 22,806 | 35,611 | 1.0% | (35.3)% | ||||||||||||||||
Short-term operating lease obligations | 11,437 | 11,807 | 11,841 | (3.1)% | (3.4)% | ||||||||||||||||
Other current liabilities | 55,285 | 62,523 | 64,142 | (11.6)% | (13.8)% | ||||||||||||||||
Total current liabilities | 89,750 | 172,136 | 111,594 | (47.9)% | (19.6)% | ||||||||||||||||
Long-term debt, net | 259,433 | 189,566 | 305,283 | 36.9% | (15.0)% | ||||||||||||||||
Long-term operating lease obligations | 56,108 | 56,649 | 64,660 | (1.0)% | (13.2)% | ||||||||||||||||
Other long-term liabilities | 87,715 | 100,754 | 110,996 | (12.9)% | (21.0)% | ||||||||||||||||
Total equity | 75,573 | 71,709 | 182,140 | 5.4% | (58.5)% | ||||||||||||||||
Total liabilities and equity | $ | 568,579 | $ | 590,814 | $ | 774,673 | (3.8)% | (26.6)% | |||||||||||||
"NM" means not meaningful | |||||||||||||||||||||
CORE LABORATORIES N.V. & SUBSIDIARIES CONDENSED CONSOLIDATED STATEMENTS OF CASH FLOWS (amounts in thousands) (Unaudited) | ||||||||||||
Three Months Ended | Twelve Months ended | |||||||||||
December 31, 2020 | December 31, 2020 | December 31, 2019 | ||||||||||
CASH FLOWS FROM OPERATING ACTIVITIES | ||||||||||||
Income (loss) from continuing operations | $ | 13,944 | $ | (97,073) | $ | 94,284 | ||||||
Income (loss) from discontinued operations | (424) | (424) | 7,833 | |||||||||
Net income (loss) | $ | 13,520 | $ | (97,497) | $ | 102,117 | ||||||
Adjustments to reconcile net income to net cash provided by operating activities: | ||||||||||||
Stock-based compensation | (8,860) | 7,394 | 20,879 | |||||||||
Depreciation and amortization | 4,837 | 20,867 | 22,605 | |||||||||
Impairments, inventory write-down and other charges | 443 | 132,579 | — | |||||||||
Deferred income tax | 798 | (12,216) | (36,345) | |||||||||
Gain on sale of business | — | — | (1,154) | |||||||||
(Gain) loss on sale of discontinued operations | 573 | 573 | (8,411) | |||||||||
Accounts receivable | 1,192 | 46,421 | (3,191) | |||||||||
Inventory | 4,351 | 1,471 | (3,892) | |||||||||
Accounts payable | 424 | (12,838) | (3,757) | |||||||||
Other adjustments to net income | (20,190) | (28,886) | 676 | |||||||||
Net cash provided by (used in) by operating activities | $ | (2,912) | $ | 57,868 | $ | 89,527 | ||||||
CASH FLOWS FROM INVESTING ACTIVITIES | ||||||||||||
Capital expenditures | $ | (3,302) | $ | (11,880) | $ | (22,269) | ||||||
Proceeds from sale of business | — | — | 2,980 | |||||||||
Proceeds from cash surrender value of company-owned life insurance | 11,509 | 20,443 | — | |||||||||
Proceeds (adjustments) from sale of discontinued operations | (225) | (225) | 14,789 | |||||||||
Other investing activities | 465 | (487) | (1,177) | |||||||||
Net cash provided by (used in) investing activities | $ | 8,447 | $ | 7,851 | $ | (5,677) | ||||||
CASH FLOWS FROM FINANCING ACTIVITIES | ||||||||||||
Repayment of debt borrowings | $ | (31,000) | $ | (102,000) | $ | (123,000) | ||||||
Proceeds from debt borrowings | 26,000 | 56,000 | 138,000 | |||||||||
Dividends paid | (445) | (12,446) | (97,574) | |||||||||
Repurchase of treasury shares | (1,201) | (2,794) | (3,308) | |||||||||
Other financing activities | (229) | (1,765) | — | |||||||||
Net cash used in financing activities | $ | (6,875) | $ | (63,005) | $ | (85,874) | ||||||
NET CHANGE IN CASH AND CASH EQUIVALENTS | (1,340) | 2,714 | (2,024) | |||||||||
CASH AND CASH EQUIVALENTS, beginning of period | 15,146 | 11,092 | 13,116 | |||||||||
CASH AND CASH EQUIVALENTS, end of period | $ | 13,806 | $ | 13,806 | $ | 11,092 | ||||||
Non-GAAP Information
Management believes that the exclusion of certain income and expenses enables it to evaluate more effectively the Company's operations period-over-period and to identify operating trends that could otherwise be masked by the excluded Items. For this reason, we use certain non-GAAP measures that exclude these Items; and we feel that this presentation provides a clearer comparison with the results reported in prior periods. The non-GAAP financial measures should be considered in addition to, and not as a substitute for, the financial results prepared in accordance with GAAP, as more fully discussed in the Company's financial statement and filings with the Securities and Exchange Commission.
Reconciliation of Operating Income, Income from Continuing Operations and Earnings Per Diluted Share from Continuing Operations (amounts in thousands, except per share data) (Unaudited) | ||||||||||||
Operating Income from Continuing Operations | ||||||||||||
Three Months Ended | ||||||||||||
December 31, 2020 | September 30, 2020 | December 31, 2019 | ||||||||||
GAAP reported | $ | 23,404 | $ | 11,331 | $ | 21,055 | ||||||
Stock compensation 1 | (11,934) | — | — | |||||||||
Inventory write-down | 443 | — | — | |||||||||
Cost reduction and other charges | — | — | 2,578 | |||||||||
Facility exit cost | 256 | — | — | |||||||||
Foreign exchange losses (gains) | 852 | 982 | 1,359 | |||||||||
Excluding specific items | $ | 13,021 | $ | 12,313 | $ | 24,992 | ||||||
Income from Continuing Operations | ||||||||||||
Three Months Ended | ||||||||||||
December 31, 2020 | September 30, 2020 | December 31, 2019 | ||||||||||
GAAP reported | $ | 13,944 | $ | 2,996 | $ | 10,290 | ||||||
Stock compensation 1 | (11,934) | — | — | |||||||||
Inventory write-down | 301 | — | — | |||||||||
Cost reduction and other charges | — | — | 2,062 | |||||||||
Facility exit cost | 174 | — | — | |||||||||
Debt restructuring | — | 1,223 | — | |||||||||
Impact of higher (lower) tax rate 2 | 5,018 | 2,773 | 3,684 | |||||||||
Foreign exchange losses (gains) | 578 | 344 | 1,087 | |||||||||
Excluding specific items | $ | 8,081 | $ | 7,336 | $ | 17,123 | ||||||
Earnings Per Diluted Share from Continuing Operations | ||||||||||||
Three Months Ended | ||||||||||||
December 31, 2020 | September 30, 2020 | December 31, 2019 | ||||||||||
GAAP reported | $ | 0.31 | $ | 0.07 | $ | 0.23 | ||||||
Stock compensation 1 | (0.27) | — | — | |||||||||
Inventory write-down | 0.01 | — | — | |||||||||
Cost reduction and other charges | — | — | 0.05 | |||||||||
Debt restructuring | — | 0.03 | — | |||||||||
Impact of higher (lower) tax rate 2 | 0.11 | 0.06 | 0.08 | |||||||||
Foreign exchange losses (gains) | 0.02 | — | 0.02 | |||||||||
Excluding specific items | $ | 0.18 | $ | 0.16 | $ | 0.38 | ||||||
(1) Includes an adjustment to reverse previously recognized stock compensation expense for shares that were granted but did not vest and | ||||||||||||
(2) Includes adjustments to reflect tax expense at a normalized rate of 20%. | ||||||||||||
Segment Information (amounts in thousands) (Unaudited) | ||||||||||||
Operating Income from Continuing Operations | ||||||||||||
Three Months Ended December 31, 2020 | ||||||||||||
Reservoir | Production | Corporate and | ||||||||||
GAAP reported | $ | 19,426 | $ | 4,495 | $ | (517) | ||||||
Stock compensation | (7,713) | (3,523) | — | |||||||||
Foreign exchange losses | 578 | 202 | 73 | |||||||||
Excluding specific items | $ | 12,291 | $ | 1,174 | $ | (444) | ||||||
Return on Invested Capital
Return on Invested Capital ("ROIC") is based on Bloomberg's calculation on the trailing four quarters from the most recently reported quarter and the balance sheet of the most recent reported quarter, and is presented based on our belief that this non-GAAP measure is useful information to investors and management when comparing our profitability and the efficiency with which we have employed capital over time relative to other companies. ROIC is not a measure of financial performance under GAAP and should not be considered as an alternative to net income.
ROIC is defined by Bloomberg as Net Operating Profit (Loss) ("NOP") less Cash Operating Tax ("COT") divided by Total Invested Capital ("TIC"), where NOP is defined as GAAP net income before minority interest plus the sum of income tax expense, interest expense, and pension expense less pension service cost and COT is defined as income tax expense plus the sum of the change in net deferred taxes, and the tax effect on interest expense and TIC is defined as GAAP stockholder's equity plus the sum of net long-term debt, allowance for doubtful accounts, net balance of deferred taxes, income tax payable, and other charges.
The Board has established an internal performance metric of demonstrating superior ROIC performance relative to the oilfield service companies listed as Core's Comp Group by Bloomberg. In 2020, Core Lab recorded $133 million in non-cash charges associated with impairment of goodwill, intangible assets and inventory. Excluding these adjustments, Core's calculation of ROIC using Bloomberg's formula was 4.7%.
Reconciliation of ROIC (amounts in millions, except for ROIC and WACC data) (Unaudited) | ||||||||||||
Bloomberg | Effect of non-cash | Excluding non- | ||||||||||
Net operating profit | $ | (79.3) | $ | 132.6 | $ | 53.3 | ||||||
Cash operating taxes | 51.2 | (20.8) | 30.4 | |||||||||
Total invested capital | 362.1 | 126.7 | 488.8 | |||||||||
Return on invested capital | (36.0) | % | NM | 4.7 | % | |||||||
Weighted average cost of capital | 6.9 | % | ||||||||||
Free Cash Flow
Core uses the non-GAAP measure of free cash flow to evaluate its cash flows and results of operations. Free cash flow is an important measurement because it represents the cash from operations, in excess of capital expenditures, available to operate the business and fund non-discretionary obligations. Free cash flow is not a measure of operating performance under GAAP, and should not be considered in isolation nor construed as an alternative consideration to operating income, net income, earnings per share, or cash flows from operating, investing, or financing activities, each as determined in accordance with GAAP. Free cash flow should not be considered a measure of liquidity. Moreover, since free cash flow is not a measure determined in accordance with GAAP and thus is susceptible to varying interpretations and calculations, free cash flow as presented may not be comparable to similarly titled measures presented by other companies.
Computation of Free Cash Flow (amounts in thousands) (Unaudited) | |||||||||
Three Months Ended | Twelve Months ended | ||||||||
December 31, 2020 | December 31, 2020 | ||||||||
Net cash provided by (used in) operating activities | $ | (2,912) | $ | 57,868 | |||||
Capital expenditures | (3,302) | (11,880) | |||||||
Free cash flow | $ | (6,214) | $ | 45,988 | |||||


SOURCE Core Laboratories N.V.
© 2024 Benzinga.com. Benzinga does not provide investment advice. All rights reserved.
Date | ticker | name | Actual EPS | EPS Surprise | Actual Rev | Rev Surprise |
|---|
Trade confidently with insights and alerts from analyst ratings, free reports and breaking news that affects the stocks you care about.

