


U.S. Wage Growth Accelerated to 3.5 Percent Annually; Large Firms are the Stellar Performers at 4.8 Percent
U.S. workers are earning nearly $1.00 more per hour on average than they were this time last year
PR Newswire
ROSELAND, N.J., Oct. 24, 2018
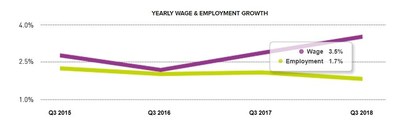
ROSELAND, N.J., Oct. 24, 2018 /PRNewswire/ -- Wages for U.S. workers grew 3.5 percent over the last year, increasing the average wage level by $0.95 to $27.81 an hour, according to the ADP Research Institute® Workforce Vitality Report (WVR) released today. The growth, accelerating to 3.5 percent annual as of September 2018, was driven by strong wage gains for workers in the professional and business services industry, representing almost 17 percent of the workforce, (3.5 percent wage growth, $35.23 average hourly wage) and trade, representing 22 percent of the workforce, (3.9 percent wage growth, $24.57 average hourly wage). The West (4.3 percent, $29.88) and large businesses (4.8 percent, $28.84) also contributed. Employees in the resources and mining industry saw their wages decrease (-0.2 percent, $34.91) and businesses with less than 50 employees experienced the slowest wage growth (2.0 percent, $25.56).


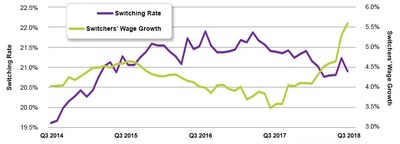
"Full employment is upon us," said Ahu Yildirmaz, co-head of the ADP Research Institute. "This is evident in the gradual slowdown we've seen in overall job switching for the past year, coupled with an acceleration in wage growth for switchers. As the labor market tightened, employers focused on providing the pay and benefits that would attract and retain skilled talent, making job holders less apt to switch."
Among industries, information continued to lead the way for both wage level and wage growth. In addition to the top overall wage growth number of 6.2 percent, those who successfully switched positions to the information industry had wage growth of 9.8 percent. Employment in the information industry improved to 2.1 percent.
Job switchers in professional and business services and construction also realized high wage growth of 9.4 and 7.5 percent, respectively. In trade, the largest sector, job holders experienced stronger growth in wages than the workers who switched to the industry, 5.2 percent versus 3.8 percent.
Table 1: Wage and Employment Growth by Industry – September 2018
Industry | Wages | YOY Wage Growth | Yearly Growth | ||||
All | Holders | Entrants | Switchers | Employment | Switching | ||
-ALL- | $27.81 | 3.5% | 5.2% | 4.1% | 5.6% | 1.7% | 20.9% |
Goods | |||||||
Construction | $27.83 | 2.6% | 5.6% | 4.1% | 7.5% | 3.1% | 16.5% |
Manufacturing | $28.94 | 3.2% | 5.2% | 8.4% | 5.5% | 1.6% | 16.7% |
Resources and | $34.91 | -0.2% | 5.1% | -1.8% | 2.6% | 7.2% | 10.7% |
Services | |||||||
Information | $42.44 | 6.2% | 6.3% | 3.2% | 9.8% | 2.1% | 17.5% |
Finance and | $32.61 | 3.4% | 5.1% | 0.5% | 5.7% | 1.7% | 18.4% |
Professional | $35.23 | 3.5% | 5.4% | 6.2% | 9.4% | 1.2% | 24.6% |
Education and | $26.59 | 3.4% | 4.6% | 3.2% | 3.5% | 2.2% | 20.2% |
Leisure and | $17.10 | 4.0% | 5.9% | 3.9% | -1.3% | 2.4% | 24.3% |
Trade, | $24.57 | 3.9% | 5.2% | 3.1% | 3.8% | 1.0% | 22.2% |
Workers in the West outpaced other regions with 4.3 percent wage growth and 2.6 percent employment growth. Job switchers also fared best in the West experiencing a wage growth of 8.7 percent. Workers in the South had the lowest wage growth at 2.8 percent and Midwest had the worst employment growth at 1.1 percent. By firm size, workers at large firms had the highest wage growth rate at 4.8 percent, with employment growth at 2.4 percent.
Table 2: Wage and Employment Growth by Region and Firm Size – September 2018
Region | Wages | YOY Wage Growth | Yearly Growth | ||||
All | Holders | Entrants | Switchers | Employment | Switching | ||
-USA- | $27.81 | 3.5% | 5.2% | 4.1% | 5.6% | 1.7% | 20.9% |
MIDWEST | $25.77 | 3.4% | 5.0% | 3.8% | 4.2% | 1.1% | 19.8% |
NORTHEAST | $31.26 | 4.1% | 4.9% | 5.0% | 6.0% | 1.3% | 22.2% |
SOUTH | $26.09 | 2.8% | 5.0% | 3.3% | 4.0% | 1.9% | 20.7% |
WEST | $29.88 | 4.3% | 5.9% | 4.7% | 8.7% | 2.6% | 21.2% |
Company Size | |||||||
-ALL- | $27.81 | 3.5% | 5.2% | 4.1% | 5.6% | 1.7% | 20.9% |
49 or less | $25.56 | 2.0% | 4.5% | 3.2% | 5.4% | 0.5% | 15.0% |
50 to 499 | $28.08 | 3.0% | 5.0% | 4.4% | 5.2% | 1.9% | 22.8% |
500 to 999 | $29.08 | 3.0% | 5.6% | 4.6% | 4.7% | 2.4% | 21.5% |
1000 or more | $28.84 | 4.8% | 5.6% | 4.4% | 6.0% | 2.4% | 23.7% |
The WVR also revealed that more than 20.9 percent of U.S. employees successfully switched firms in the last year. This highlights an overall slowdown in job switching. On the other hand, we have seen wage growth for job switchers gradually accelerating during this same time period, currently at 5.6 percent. Given that the U.S. labor market is at full employment, and there is a shortage of skilled labor, this is not surprising as employers look to attract and retain top talent with premium wages.


To see detailed workforce vitality components for the third quarter of 2018, including data broken down by region, firm size, industry, gender, and age, visit http://workforcereport.adp.com/. The fourth quarter 2018 ADP Workforce Vitality Report will be released on Wednesday, January 23, 2019
About the ADP Workforce Vitality Report
The ADP Workforce Vitality Report (WVR) was developed by the ADP Research Institute (ADPRI). It is an unprecedented, in-depth monthly analysis (published quarterly) of the vitality of the U.S. labor market based on actual data that identifies labor market trends and dynamics across multiple dimensions. These dimensions include employment growth, job switching, wage growth and hours worked. In addition to the macro data presented in the report, there are also segment-specific findings by industry, state, gender, age, experience, and pay level. Established in October 2014, the report methodology was updated in April 2018 utilizing monthly data to include additional data points and deeper insights. For more information about the report, please visit http://workforcereport.adp.com/.
About ADP (NASDAQ-ADP)
Powerful technology plus a human touch. Companies of all types and sizes around the world rely on ADP cloud software and expert insights to help unlock the potential of their people. HR. Talent. Benefits. Payroll. Compliance. Working together to build a better workforce. For more information, visit ADP.com.
ADP, the ADP logo, ADP A more human resource and ADP Research Institute are registered trademarks of ADP, LLC. All other marks are the property of their respective owners.
Copyright © 2018 ADP, LLC.
![]()

View original content to download multimedia:http://www.prnewswire.com/news-releases/us-wage-growth-accelerated-to-3-5-percent-annually-large-firms-are-the-stellar-performers-at-4-8-percent-300736952.html


SOURCE ADP, LLC


© 2024 Benzinga.com. Benzinga does not provide investment advice. All rights reserved.
Trade confidently with insights and alerts from analyst ratings, free reports and breaking news that affects the stocks you care about.

