


Enercare Reports First Quarter 2018 Results
Canada NewsWire
TORONTO, May 4, 2018
EBITDA grows 13%, Enercare Smarter Home Launched and U.S. Rental Penetration More than Doubles
TORONTO, May 4, 2018 /CNW/ - Enercare Inc. ("Enercare") ECI, one of North America's leading providers of essential home and commercial services, reported its financial results for the first quarter ended March 31, 2018.
"Enercare had a great first quarter, delivering revenue and EBITDA growth that was driven by strong operational performance," said John Macdonald, President and Chief Executive Officer. "With the U.S. same center rental rate reaching 10% in March and the transformative launch of Enercare Smarter Home, we are looking forward to a successful 2018 that will solidify our position as a home services market leader."
First Quarter 2018 Highlights
Total revenue for the first quarter was $279.1 million, an increase of $30.4 million or 12% compared to the same period in 2017.
- EBITDA was $57 million for the first quarter, an increase of 13% compared to $50.5 million in 2017.
- Adjusted EBITDA was $58.7 million for the first quarter, an increase of 12% compared to $52.5 million in 2017.
- Enercare Home Services had net rental unit growth of 2,271, the eleventh consecutive quarter of net growth in rental units.
- Sub-metering increased contracted units by 4,201 in the first quarter.
- Service Experts increased heating, ventilation and air conditioning ("HVAC") and water heater originations by 11% in the first quarter.
Financial Highlights
(in millions of Canadian dollars except per unit amounts)1
|
Three months ended March 31, | |||||
|
($ millions) |
2018 |
2017 |
Change | ||
|
Total revenue |
$ |
279.1 |
$ |
248.7 |
12% |
|
EBITDA |
$ |
57.0 |
$ |
50.5 |
13% |
|
Adjusted EBITDA2 |
$ |
58.7 |
$ |
52.5 |
12% |
|
Net earnings |
$ |
4.9 |
$ |
(3.0) |
260% |
|
Basic earnings per Share |
$ |
0.05 |
$ |
(0.03) |
266% |
|
Payout Ratio - Maintenance2 |
88% |
96% |
(8)* | ||
|
Payout Ratio2 |
375% |
380% |
(5)* | ||
|
Enercare Home Services Rental attrition (units) |
6,875 |
7,706 |
(11%) | ||
|
Enercare Home Services Rental additions net of attrition |
2,271 |
1,130 |
101% | ||
|
Sub-metering contracted units |
4,201 |
10,146 |
(59%) | ||
|
*percentage points |
|
_______________________________________ | |
|
1 |
Unless otherwise noted, amounts are reported in thousands, except customers, units, common shares of Enercare ("Shares") and per Share amounts and percentages. |
|
2 |
Adjusted EBITDA, Payout Ratio and Payout Ratio - Maintenance are Non-IFRS financial measures. Enercare changed its definition of Adjusted EBITDA in the first quarter of 2018. Refer to the Non-IFRS Financial and Performance Measures section in the MD&A. |
CONSOLIDATED RESULTS OF OPERATIONS
|
Three months ended March 31, |
Percent | ||||
|
(000's) |
2018 |
2017 |
Change |
Change | |
|
Consolidated |
|||||
|
Revenue |
$279,070 |
$248,696 |
$30,374 |
12% | |
|
Gross Margin3 |
150,113 |
139,314 |
10,799 |
8% | |
|
EBITDA |
$ 57,029 |
$ 50,521 |
$ 6,508 |
13% | |
|
Net loss on disposal |
1,221 |
1,857 |
(636) |
(34%) | |
|
Acquisition/divestiture SG&A |
481 |
104 |
377 |
362% | |
|
Adjusted EBITDA |
$ 58,731 |
$ 52,482 |
$ 6,249 |
12% | |
|
Depreciation and amortization |
39,811 |
38,399 |
1,412 |
4% | |
|
Interest expense |
10,333 |
15,844 |
(5,511) |
(35%) | |
|
Current tax expense |
6,555 |
5,415 |
1,140 |
21% | |
|
Deferred tax (recovery) |
(4,524) |
(6,105) |
1,581 |
26% | |
|
Net earnings/(loss) |
$ 4,854 |
$ (3,032) |
$ 7,886 |
260% | |
Revenue
Total revenues of $279,070 for the first quarter of 2018 increased by $30,374 or 12% compared to the same period in 2017, primarily as a result of a $23,668 or 19% increase in Service Experts driven by higher HVAC sales volumes and acquisitions. Enercare Home Services also increased $5,480 or 5%, primarily from rental rate increases, net rental unit growth and asset mix changes, while Sub-metering increased $1,226 or 13%, primarily from growth in Billable units. Recurring revenue for Sub-metering is now presented net of commodity expense in conjunction with IFRS 15 changes that became effective on a retrospective basis on January 1, 2018. Refer to the "Changes in Accounting Policies" section of Enercare's management discussion and analysis for the first quarter ended March 31, 2018 (the "MD&A").
Gross Margin
Total Gross Margin for the first quarter of 2018 was $150,113, an increase of $10,799 or 8%, compared to the same period in 2017. The increase was primarily as a result of a $6,165 or 15% increase in Service Experts Gross Margin and $3,062 or 3% increase in Enercare Home Services Gross Margin. The increase in Gross Margin was primarily driven by the $30,374 or 12% increase in revenues, partly offset by higher service job volumes in Enercare Home Services, resulting from the colder weather experienced in January of 2018, and higher general liability, workers compensation and automobile insurance costs and fewer supplier rebates in Service Experts.
EBITDA
EBITDA of $57,029 increased by $6,508 or 13% in the first quarter of 2018 compared to the same period in 2017, driven primarily by a $6,194 or 10% increase in Enercare Home Services, a $1,609 or 63% increase in Sub-metering and an increase of $81 or 2% in Service Experts, partly offset by an increase in Corporate selling, general and administrative expenses ("SG&A") of $1,376 or 17%. The increase in EBITDA was primarily driven by improved Gross Margin, partly offset by $5,530 or 6% of higher total SG&A costs, driven by higher marketing related selling expenses of $2,224 primarily in Service Experts, professional fees of $1,916 partly driven by Enercare's enterprise resource planning ("ERP") and customer relationship management ("CRM") systems implementation, and $1,564 of higher wages and benefits. The increase in wages and benefits was primarily driven by acquisitions in Service Experts, partly offset by approximately $3,700 of lower stock-based compensation costs resulting from a decrease in the Share price.
The following table shows total spending on SG&A expenses related to Enercare's implementation of its ERP and CRM systems during the three months ended March 31, 2018 and 2017.
|
_______________________________ | |
|
3 |
Gross margin is a Non-IFRS financial measure. Refer to the Non-IFRS Financial and Performance Measures section in the MD&A |
|
Three months ended March 31, |
||||
|
(000's) |
2018 |
2017 |
Change | |
|
SG&A expenditures |
||||
|
Corporate |
$ 761 |
$ 98 |
$663 | |
|
Service Experts |
319 |
- |
319 | |
|
Total |
$1,080 |
$ 98 |
$982 | |
Adjusted EBITDA
Adjusted EBITDA of $58,731 in the first quarter of 2018 was $6,249 or 12% higher compared to the same period in 2017, after removing from EBITDA the impact of the net loss on disposal of equipment and other assets and SG&A expenditures associated with acquisitions and divestitures. Acquisition and divestiture related expenditures of $481 were primarily associated with the acquisition of CS Newco, LLC and Finch Newco, LLC, the acquisition of Midway Services, LLC and MSICORP, LLC, and the disposition of several centers in Canada and the foundation business in the U.S. during the first quarter of 2018. Acquisition related expenditures were $104 in the same period in 2017.
Depreciation and Amortization
Amortization expense of $39,811 increased by $1,412 or 4% in the first quarter of 2018, compared to the same period in 2017, primarily due to an increasing rental and capital asset base, acquisitions and Sub-metering capital investments, which are amortized over a shorter life than those of the Enercare Home Services business.
Net Loss on Disposal of Equipment and Other Assets
Enercare reported a net loss on disposal of equipment and other assets of $1,221 in the first quarter of 2018, a decrease of $636 or 34% over the same period in 2017. The net loss on disposal during the first quarter of 2018 includes a $331 loss on the sale of the foundation business that was acquired as part of the CS Newco, LLC and Finch Newco, LLC acquisition. This was partly offset by a $113 gain on the sale of four Service Experts centers which was completed to address Enercare's Ontario market overlap, resulting from the acquisition of Service Experts by Enercare, through an indirect wholly-owned subsidiary of Enercare Solutions Inc. ("Enercare Solutions"), on May 11, 2016 (the "SE Transaction"), between the service territory of those Service Experts centers with that of certain Enercare Home Services franchisees.
The decrease in net loss on disposal is also driven by a write-off of $845 in the first quarter of 2017 relating to stranded technology investments resulting from going concern issues with a supplier that was developing software solutions for the Enercare Home Services business.
Interest Expense
|
Three months ended March 31, | |||
|
(000's) |
2018 |
2017 | |
|
Interest expense payable in cash |
$9,858 |
$9,640 | |
|
Make-whole payment on early redemption of senior debt |
- |
5,049 | |
|
Non-cash items: |
|||
|
Notional interest on employee benefit plans |
238 |
226 | |
|
Amortization of financing costs |
237 |
929 | |
|
Interest expense |
$10,333 |
$15,844 | |
Interest expense payable in cash increased by $218 or 2% to $9,858 in the first quarter of 2018 compared to the same period in 2017. The increase was primarily related to an increase in the amounts drawn under the 5-year variable rate, revolving credit facility with a maximum amount of $200,000 ("2014 Revolver") and changes in variable interest rates. A make-whole payment for the early redemption of the $250,000 of 4.30% Series 2012-1 Senior Unsecured Notes of Enercare Solutions, which were redeemed using proceeds from the offering of the issuance of the $275,000 of 3.38% Series 2017-1 Senior Unsecured Notes of Enercare Solutions, due February 21, 2022 and the $225,000 of 3.99% Series 2017-2 Senior Unsecured Notes of Enercare Solutions, due February 21, 2024 during the first quarter of 2017 resulted in additional interest expense of $5,049.
Income Taxes
Enercare reported current tax expense of $6,555 in the first quarter of 2018, an increase of $1,140 compared to the same period in 2017. The increase was primarily from higher taxes owed in 2018, resulting from the sale of certain centers by SE Canada Inc. The deferred income tax recovery of $4,524 in the first quarter of 2018 decreased by $1,581 compared to the same period in 2018, primarily as a result of temporary difference reversals in the Enercare Home Services and Service Experts businesses.
Net Earnings
Net earnings were $4,854 in the first quarter of 2018, an increase of $7,886, compared to the first quarter of 2017, reflecting higher EBITDA and lower interest expense, partly offset by higher depreciation and amortization and an increase in income taxes.
Average Foreign Exchange
Enercare's results of operations may be affected by the impact of movements in foreign exchange rates from operations whose functional currency is not in Canadian dollars. The results of these foreign operations are translated into Canadian dollars using the average exchange rates shown in the table below for the corresponding periods. Such translations predominantly relate to Service Experts' U.S. operations whose functional currency is U.S. dollars. Where relevant throughout the "Segmented Results of Operations" discussion in this news release, reference is made to any material impacts resulting from movements in foreign exchange rates on reported amounts. The following table illustrates the approximate impact of foreign exchange on Enercare's results for the three months ended March 31, 2018 assuming average exchange rates during the current period were held constant to those of the same period in 2017.
|
(in $000's) |
Three months ended March 31, | ||
|
2018 |
2017 |
Difference | |
|
Average exchange rate (US$/CDN$1.00) |
$0.7910 |
$0.7553 |
$0.0357 |
|
Three months ended March 31, | |||
|
2018 |
2018 Constant Currency* |
Impact of Foreign Exchange | |
|
Revenue |
$130,684 |
$136,845 |
$ (6,161) |
|
Gross Margin |
41,381 |
43,360 |
(1,979) |
|
SG&A expenses |
44,348 |
46,404 |
(2,056) |
|
Loss on disposal |
253 |
258 |
(5) |
|
EBITDA |
$ (82) | ||
|
* |
Constant currency is a non-IFRS presentation that other companies may calculate differently. It approximates the impact of foreign exchange on Enercare's results to improve comparability, assuming average exchange rates during the current period were held constant to those of the same period in 2017. |
SEGMENTED RESULTS OF OPERATIONS
|
Three months ended March 31, 2018 (000's) |
Enercare Home |
Service |
Sub-metering |
Corporate |
Total | |
|
Revenue: |
||||||
|
Contracted revenue |
$109,526 |
$ 13,664 |
$ 9,129 |
$ - |
$ 132,319 | |
|
Sales and other services |
7,244 |
137,745 |
1,449 |
- |
146,438 | |
|
Financing income |
285 |
23 |
5 |
- |
313 | |
|
Total revenue |
$117,055 |
$151,432 |
$ 10,583 |
$ - |
$ 279,070 | |
|
Expenses: |
||||||
|
Cost of goods sold: |
||||||
|
Maintenance & servicing costs |
17,829 |
10,698 |
- |
- |
28,527 | |
|
Sales and other services |
6,404 |
93,219 |
807 |
- |
100,430 | |
|
Total cost of goods sold |
24,233 |
103,917 |
807 |
- |
128,957 | |
|
Gross Margin |
92,822 |
47,515 |
9,776 |
- |
150,113 | |
|
SG&A expenses |
26,330 |
50,862 |
5,632 |
9,606 |
92,430 | |
|
Foreign exchange |
(554) |
17 |
(24) |
(6) |
(567) | |
|
Amortization expense |
31,703 |
5,100 |
2,077 |
931 |
39,811 | |
|
Net loss on disposal of equipment and other assets |
1,110 |
111 |
- |
- |
1,221 | |
|
Interest expense: |
||||||
|
Interest expense payable in cash |
9,858 | |||||
|
Make-whole charge on early redemption of debt |
- | |||||
|
Non-cash interest expense |
475 | |||||
|
Total interest expense |
10,333 | |||||
|
Total expenses |
272,185 | |||||
|
Earnings before income taxes |
6,885 | |||||
|
Current tax (expense) |
(6,555) | |||||
|
Deferred tax recovery |
4,524 | |||||
|
Net earnings |
$ 4,854 | |||||
|
EBITDA |
$ 65,936 |
$ (3,475) |
$ 4,168 |
$ (9,600) |
$ 57,029 | |
|
Adjusted EBITDA |
$ 67,046 |
$ (2,883) |
$ 4,168 |
$ (9,600) |
$ 58,731 | |
|
Three months ended March 31, 2017 (000's) |
Enercare Home |
Service |
Sub-metering |
Corporate |
Total | |
|
Revenues: |
||||||
|
Contracted revenue |
$104,489 |
$ 11,377 |
$ 7,651 |
$ - |
$123,517 | |
|
Sales and other services |
6,837 |
116,377 |
1,704 |
- |
124,918 | |
|
Financing income |
249 |
10 |
2 |
- |
261 | |
|
Total revenue |
$111,575 |
$127,764 |
$ 9,357 |
$ - |
$248,696 | |
|
Expenses: |
||||||
|
Cost of goods sold: |
||||||
|
Maintenance & servicing costs |
16,264 |
9,089 |
- |
- |
25,353 | |
|
Sales and other services |
5,551 |
77,325 |
1,153 |
- |
84,029 | |
|
Total cost of goods sold |
21,815 |
86,414 |
1,153 |
- |
109,382 | |
|
Gross Margin |
89,760 |
41,350 |
8,204 |
- |
139,314 | |
|
SG&A expenses |
28,077 |
44,925 |
5,674 |
8,224 |
86,900 | |
|
Foreign exchange |
78 |
(3) |
(39) |
- |
36 | |
|
Amortization expense |
30,880 |
5,150 |
1,770 |
599 |
38,399 | |
|
Net loss/(gain) on disposal of equipment and other assets |
1,863 |
(16) |
10 |
- |
1,857 | |
|
Interest expense: |
||||||
|
Interest expense payable in cash |
9,640 | |||||
|
Make-whole charge on early redemption of debt |
5,049 | |||||
|
Non-cash interest expense |
1,155 | |||||
|
Total interest expense |
15,844 | |||||
|
Total expenses |
252,418 | |||||
|
Earnings before income taxes |
(3,722) | |||||
|
Current tax (expense) |
(5,415) | |||||
|
Deferred tax recovery |
6,105 | |||||
|
Net loss |
$ (3,032) | |||||
|
EBITDA |
$ 59,742 |
$ (3,556) |
$ 2,559 |
$ (8,224) |
$ 50,521 | |
|
Adjusted EBITDA |
$ 61,605 |
$ (3,468) |
$ 2,569 |
$ (8,224) |
$ 52,482 | |
Enercare Home Services
|
Three months ended March 31, |
|||||
|
(000's) |
2018 |
2017 |
Change |
Percent Change | |
|
Revenue |
$117,055 |
$111,575 |
$ 5,480 |
5% | |
|
Gross Margin |
$ 92,822 |
$ 89,760 |
$ 3,062 |
3% | |
|
EBITDA |
$ 65,936 |
$ 59,742 |
$ 6,194 |
10% | |
|
Adjusted EBITDA |
$ 67,046 |
$ 61,605 |
$ 5,441 |
9% | |
Revenue
Enercare Home Services revenue of $117,055 for the first quarter of 2018 increased by $5,480 or 5% compared to the same period in 2017, primarily driven by a $5,037 increase in contracted revenue and a $407 increase in sales and other services revenue.
Contracted revenue in Enercare Home Services represents revenue generated by the Rentals portfolio and protection plan contracts, while sales and other services revenue mainly pertains to the sale of residential furnaces, boilers and air conditioners, as well as plumbing and duct cleaning.
Contracted units outstanding and net portfolio unit activity along with sales units are presented in the following table:
|
Unit/Contract Continuity (000's)* Three months ended March 31, |
2018 |
2017 | |||||||||
|
Rentals |
HVAC |
Protection |
Rentals |
HVAC |
Protection | ||||||
|
Units/contracts - start of period |
1,143 |
- |
552 |
1,136 |
- |
542 | |||||
|
Portfolio additions |
9 |
- |
17 |
9 |
- |
19 | |||||
|
Attrition |
(7) |
- |
(15) |
(8) |
- |
(15) | |||||
|
Units / contracts - end of period |
1,145 |
- |
554 |
1,137 |
- |
546 | |||||
|
Asset exchanges – units retired & replaced |
12 |
- |
- |
10 |
- |
- | |||||
|
Sales units |
- |
2 |
- |
- |
1 |
- | |||||
|
% change during the period |
0.2% |
-% |
0.4% |
0.1% |
0.7% | ||||||
|
% of units/contracts from start of period: |
|||||||||||
|
Portfolio additions (net of acquisitions) |
0.8% |
3.1% |
0.8% |
3.5% | |||||||
|
Attrition |
(0.6%) |
(2.7%) |
(0.7%) |
(2.8%) | |||||||
|
Asset exchanges – units retired & replaced |
1.0% |
- |
0.9% |
- | |||||||
|
* |
Enercare Home Services portfolio addition and attrition units/contracts presented have been rounded to thousands of units/contracts. To ensure consistency with rounded year to date and period end balances, the rounded units/contracts presented in the chart above may vary by +1 or -1 in certain quarters from results rounded to the nearest hundred units/contracts which may be discussed in this news release. |
Rentals
The increase in contracted revenue was primarily driven by a $5,129 or 6% increase in Rentals revenue resulting from net water heater and HVAC rental unit growth, rental rate increases and asset mix changes within the portfolio.
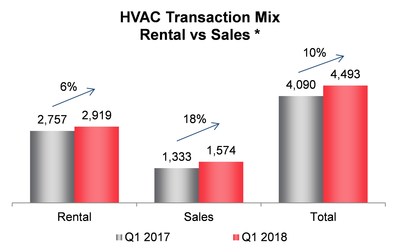
Portfolio additions were approximately 9,000 units in the first quarter of 2018, which was consistent with the same period in 2017. HVAC rental additions of 2,919 units increased by 162 or 6%, driven partly by cooler weather conditions in the first quarter of 2018, as measured by heating degree days[4], compared to the same period in 2017. Portfolio attrition of approximately 7,000 units in the first quarter of 2018 was approximately 1,000 or 13% lower compared to the same period in 2017. This represents the eleventh consecutive quarter of net rental unit growth for Enercare Home Services.
In addition to rental unit growth, Enercare Home Services is also able to grow revenue through annual rental rate increases. In January of 2017 and 2018, Enercare Home Services increased its weighted average water heater portfolio rental rate by 3.10% and 3.09%, respectively and in January 2018, increased its weighted average HVAC portfolio rental rate by 1.8%. This, in combination with asset mix changes, led to an increase in the average portfolio rental rate of 5% from 2016 to 2017 and 4% from 2017 to the first quarter of 2018.
")


|
__________________________________ | |
|
4 |
Heating/cooling degree days for a given day represent the number of Celsius degrees that the mean temperature is above or below a given base temperature, in this case 18°C. If the temperature is equal to 18°C, then the number will be zero. Values above or below the base of 18°C are used primarily to estimate the heating and cooling requirements of buildings. Temperatures below 18°C result in higher heating degree days (lower cooling degree days), while those above 18°C result in lower heating degree days (higher cooling degree days). |
Protection Plans
Enercare Home Services' protection plan revenues of $22,207 for the first quarter of 2018 increased by $92 from the same period in 2017, driven by the increase in the number of protection plans partially offset by more competitive pricing. The protection plan portfolio increased by approximately 2,000 plans during the first quarter of 2018 to 554,000 plans. This represents the fifth consecutive quarter of net protection plan growth. Protection plan additions of approximately 17,000 plans decreased by 11% in the first quarter of 2018, while attrition of approximately 15,000 plans remained consistent with the same period in 2017. Fewer protection plan additions were the result of the launch of the electrical protection plan during the first quarter of 2017, which was supported by promotional pricing. Attrition includes approximately 2,200 (2017 – 2,100) protection plans cancelled as a result of those plans being replaced by rentals as part of the Enercare Home Services growth strategy.
Sales and Other Services
During the first quarter of 2018, Enercare Home Services sales and other services revenue increased by $407 or 6% compared to the same period in 2017, primarily driven by an increase in HVAC sales. Approximately 1,574 units were sold during the quarter, representing an increase of 18% from the same period in 2017. Enercare Home Services continued to adjust its HVAC rental product offers, which shifted originations slightly more toward sales during the first quarter of 2018. The increase in sales was partially offset by more competitive pricing offered on HVAC sales units compared to the first quarter of 2017.
 (CNW Group/Enercare Inc.)")

Gross Margin
Enercare Home Services Gross Margin of $92,822 for the first quarter of 2018 increased by $3,062 or 3%, compared to the first quarter of 2017, primarily driven by a rental rate increase implemented in January 2018. Gross Margin in the first quarter of 2018 was also impacted by an increase of approximately 9% in service job volumes as a result of the colder weather experienced in January 2018.
EBITDA
Enercare Home Services EBITDA in the first quarter of 2018 increased by $6,194 or 10% to $65,936, primarily driven by a $3,062 increase in Gross Margin and lower SG&A expenditures of $1,747 and lower net loss on disposal of $753.
Enercare Home Services SG&A expenses of $26,330 in the first quarter of 2018 decreased by $1,747 or 6%, compared to the same period in 2017. The $1,747 decrease was primarily as a result of approximately $800 in lower office expenses, mainly due to Enercare's ownership of its corporate office starting in the second quarter of 2017 and $600 in lower wages and benefits, mainly due to lower stock-based compensation costs resulting from a decrease in the Share price and a transfer of IT personnel to Corporate, partially offset by other increases.
Adjusted EBITDA
Enercare Home Services Adjusted EBITDA in the first quarter of 2018 increased by $5,441 or 9% to $67,046, primarily driven by higher EBITDA excluding the decrease in net loss on disposal of $753.
Service Experts Business
|
Three months ended March 31, |
||||||||
|
(000's) |
2018 |
2017 |
Change |
Percent Change | ||||
|
Revenue |
$ |
151,432 |
$ |
127,764 |
$ |
23,668 |
19% | |
|
Gross Margin |
$ |
47,515 |
$ |
41,350 |
$ |
6,165 |
15% | |
|
EBITDA |
$ |
(3,475) |
$ |
(3,556) |
$ |
81 |
2% | |
|
Adjusted EBITDA |
$ |
(2,883) |
$ |
(3,468) |
$ |
585 |
17% | |
Revenue
Service Experts revenue was $151,432 for the first quarter of 2018, increasing by $23,668 or 19% compared to the same period in 2017, primarily due to $21,368 higher sales and other services revenue and $2,287 higher contracted revenue. Revenue growth was lower by approximately $6,161 due to fluctuations in foreign exchange compared to the same period in 2017, as discussed under the section titled "Consolidated Results of Operations - Average Foreign Exchange".
Service Experts acquired CS Operating LLC, Hammond Plumbing and Heating Inc. and Aramendia Plumbing, Heating & Air Ltd. in 2017 and CS Newco, LLC and Finch Newco, LLC, and Midway Services, LLC and MSICORP, LLC in the first quarter of 2018 and disposed of four centers located in Ontario and a foundation business in the U.S. in the first quarter of 2018. Revenue recognized from the acquisitions and divestitures are $14,376 and $1,008, respectively, for the first quarter of 2018 compared to $436 and $5,199, respectively, from the same period in 2017. These acquisitions net of divestitures resulted in revenue of $15,384 in the first quarter of 2018, a net increase of $9,748 compared to the same period in 2017.
Contracted maintenance agreement revenue increased by $1,907 or 17%, with rental revenue improving by $380 or 633%. Increased revenue for sales and other services mainly pertains to higher sales and installations of HVAC and water heaters, as well as plumbing.
Contracted revenue and sales and other services revenue are primarily driven by unit growth for these business activities as illustrated in the following table:
|
Unit/Contract Continuity (000's)* Three months ended March 31, |
2018 |
2017 | ||||||||
|
Rentals |
HVAC & |
Maintenance |
Rentals |
HVAC & |
Maintenance | |||||
|
Units/contracts - start of period |
2 |
- |
217 |
- |
- |
216 | ||||
|
Portfolio additions |
1 |
- |
20 |
1 |
- |
22 | ||||
|
Acquisitions |
- |
- |
1 |
- |
- |
- | ||||
|
Attrition |
- |
- |
(19) |
- |
- |
(21) | ||||
|
Disposition |
- |
- |
(17) |
- |
- |
- | ||||
|
Units / contracts - end of period |
3 |
- |
202 |
1 |
- |
217 | ||||
|
Asset exchanges – units retired & replaced |
- |
- |
- |
- |
- |
- | ||||
|
Sales units |
- |
15 |
- |
- |
14 |
- | ||||
|
% change during the period |
50% |
9% |
(6.9%) |
100% |
0.5% | |||||
|
% of units / contracts from start of period: |
||||||||||
|
Portfolio additions (net of acquisitions) |
50% |
9.2% |
100% |
10.2% | ||||||
|
Attrition |
- % |
(8.8%) |
- % |
(9.7%) | ||||||
|
Asset exchanges – units retired & replaced |
- % |
-% |
- % |
- % | ||||||
|
* |
Service Experts portfolio addition and attrition units/contracts presented have been rounded to thousands of units/contracts. To ensure consistency with rounded year to date and period end balances, the rounded units/contracts presented in the chart above may vary by +1 or -1 in certain quarters from results rounded to the nearest hundred units/contracts which may be discussed in this news release. |
HVAC and Water Heater Sales and Servicing
The $21,368 or 18% increase in sales and other services revenue was driven mainly by greater HVAC and water heater sales and increases in average selling prices from shifts towards higher value and ancillary product sales. During the first quarter of 2018, Service Experts sold approximately 14,584 HVAC and water heater units, an increase of 9% compared to the same period in 2017, mainly due to the acquisitions completed after the first quarter of 2017 and cooler weather trends experienced in U.S. and Canada. A comparison of HVAC and water heater sales and rentals for the first quarter of 2018 and 2017 is outlined in the chart below.
 (CNW Group/Enercare Inc.)")


Maintenance Agreements
Maintenance agreement revenue increased by $1,907 or 17% compared to the first quarter of 2017. Service Experts maintenance agreement revenue was lower by $3,386 during the first quarter of 2017 as a result of purchase accounting adjustments of deferred revenue associated with the SE Transaction. Net of these adjustments, maintenance agreement revenue decreased by $1,479, primarily from the disposition of approximately 17,000 agreements as part of Service Experts' disposal of four centers located in Ontario during in the first quarter of 2018. Excluding disposals, net maintenance agreements increased during the quarter by approximately 2,000 units compared to 1,000 units during the same period in 2017.
Rentals
Rental revenue of $440 was $380 greater than the same period in 2017 as a result of an increase in the rental portfolio of 2,600 units since the first quarter of 2017, of which 800 were added in the first quarter of 2018. The rental proportion of total residential units sold improved in the first quarter of 2018 to approximately 25.1% in Canada and 7.2% in the U.S., compared to 14.2% and 2.2% in Canada and the U.S., respectively, in the first quarter of 2017.
Had the 450 HVAC and 346 water heater rental additions been sales, as opposed to rentals, Service Experts' revenue and EBITDA would have increased by approximately $3,636 and $1,304, respectively. This estimate takes into account the impact of lost one-time sales revenue, net of rental revenue earned during the quarter, and capitalized costs that would have otherwise been included in cost of goods sold had these new HVAC and water heater rental additions been sales as opposed to rentals.
Gross Margin
Service Experts Gross Margin of $47,515 for the first quarter of 2018 increased by $6,165 or 15%, compared to the same period in 2017, primarily due to $23,668 higher revenue, partly offset by $17,503 higher cost of goods sold. Acquisitions net of divestitures contributed $4,558 of net Gross Margin in the first quarter of 2018, an increase of $2,840 compared to the same period in 2017.
Gross Margin growth was lower by approximately $1,979 due to fluctuations in foreign exchange compared to the same period in 2017, as discussed under the section titled "Consolidated Results of Operations - Average Foreign Exchange". Gross Margin in the first quarter of 2018 was also impacted by approximately $900 of higher general liability, workers compensation, and automobile insurance costs and $200 of fewer supplier rebates driven by a higher proportion of sales generated through retail channels.
During the first quarter of 2017, purchase accounting adjustments for the service obligation associated with the SE Transaction reduced Service Experts' cost of goods sold by $2,683 resulting in lower Gross Margin of $703.
EBITDA
Service Experts EBITDA loss of $3,475 in the first quarter of 2018 improved by $81 or 2% compared to the same period in 2017. The increase in Service Experts EBITDA was primarily the result of $6,165 higher Gross Margin, partly offset by $5,937 higher SG&A costs and $127 higher net loss on disposal. Service Experts EBITDA was also lower by approximately $82 due to fluctuations in foreign exchange compared to the same period in 2017, as discussed under the section titled "Consolidated Results of Operations - Average Foreign Exchange".
Acquisitions and dispositions resulted in net decrease in EBITDA of $67 in the first quarter of 2018, a decrease of $84 from the same period in 2017.
Service Experts SG&A expenses of $50,862 in the first quarter of 2018 increased by $5,937 or 13% compared to the same period in 2017. The increased expenditures were primarily as a result of higher wages and benefits of approximately $2,500, $2,100 in sales and marketing expenses, office expenses of $700 and $500 in professional fees due to greater acquisition and divestiture activities during the first quarter of 2018 compared to the same period in 2017.
Higher wages and benefits of $2,500 was driven by additional employee related expenses due to acquisitions during 2017 and the first quarter of 2018, offset by lower stock-based compensation costs due to a decrease in the Share price. The higher sales and marketing expenses of $2,100 were mainly driven by costs related to enhancements to the rental program and associated training, which began in the fourth quarter of 2017, and higher marketing costs, primarily to build brand awareness in the Dallas market.
In the first quarter of 2018, Service Experts SG&A included $481 of acquisition and disposition related expenditures associated with the acquisition of CS Newco, LLC and Finch Newco, LLC and Midway Services, LLC and MSICORP, LLC and the disposition of the business centers from the franchise overlap and a line of business from the CS Newco, LLC and Finch Newco, LLC acquisition.
The net loss on disposal during the first quarter of 2018 includes a $331 loss on the sale of the foundation business that was acquired as part of the CS Newco, LLC and Finch Newco, LLC acquisition. This was partly offset by a $113 gain on the sale of four Service Experts centers which was completed to address Enercare's Ontario market overlap, resulting from the SE Transaction, between the service territory of those Service Experts centers with that of certain Enercare Home Services franchisees.
Adjusted EBITDA
Service Experts Adjusted EBITDA loss in the first quarter of 2018 increased by $585 or 17% to a loss of $2,883, primarily driven by EBITDA as noted above excluding the increase of the net loss on disposal of $127 and a $377 increase in acquisition costs in the first quarter of 2018 compared to the same period in 2017.
Sub-metering Business
|
Three months ended March 31, |
||||
|
(000's) |
2018 |
2017 |
Change |
Percent Change |
|
Revenue |
$10,583 |
$9,357 |
$1,226 |
13% |
|
Gross Margin |
$ 9,776 |
$8,204 |
$1,572 |
19% |
|
EBITDA |
$ 4,168 |
$2,559 |
$1,609 |
63% |
|
Adjusted EBITDA |
$ 4,168 |
$2,569 |
$1,599 |
62% |
Revenue
Sub-metering revenues were $10,583 in the first quarter of 2018, an increase of $1,226 or 13% compared to the same period in 2017, primarily as a result of $1,478 higher contracted revenue, partly offset by $255 lower sales and other services revenue from sales and installation of water conservation products in apartments and condominiums of $160 and meter sales of $100.
As a result of the implementation of IFRS 15, Sub-metering revenue in the first quarter of 2017 has been restated, decreasing by $29,495. The adjustment results in revenue recognition net of commodity charges associated with the provision of service. Refer to the "Changes in Accounting Policies" section of the MD&A.
Contracted revenue is primarily driven by growth in Billable units as illustrated in the following table:
|
Unit Continuity (000's) Three months ended March 31, |
2018 |
2017 | |||||
|
Contracted |
Installed |
Billable |
Contracted |
Installed |
Billable | ||
|
Units - start of period |
261 |
183 |
130 |
235 |
165 |
116 | |
|
Net portfolio additions |
5 |
6 |
6 |
10 |
3 |
3 | |
|
Units - end of period |
266 |
189 |
136 |
245 |
168 |
119 | |
|
% change in units during the period |
1.9% |
3.3% |
4.6% |
4.3% |
1.8% |
2.6% | |
Contracted revenue increased by $1,478 or 19%, driven mainly by 17,000 additional Billable units in the first quarter of 2018 compared to the same period in 2017, coupled with an average rate increase of approximately 3.4%.
Of the 266,000 contracted units, 189,000 have meters installed and 136,000 of those units are Billable. Contracted units increased by approximately 5,000 units in the first quarter of 2018 to 266,000 units from 261,000 units, a decrease of 5,000 units or 50% compared to the approximately 10,000 unit increase in the same period in 2017, primarily due to the timing of contract sales.
Gross Margin
Sub-metering Gross Margin was $9,776 in the first quarter of 2018, increasing by $1,572 or 19%, primarily from $1,226 higher revenue and $346 lower cost of goods sold compared to the same period in 2017.
Sub-metering Gross Margin in the first quarter of 2017 has been restated as a part of IFRS 15 implementation, decreasing revenue by $29,495 and decreasing cost of goods sold by $29,495. Refer to the "Changes in Accounting Policies" section of the MD&A. The adjustment recognizes revenues net of commodity charges associated with the provision of service.
EBITDA
Sub-metering EBITDA in the first quarter of 2018 increased by $1,609 or 63% to $4,168, primarily driven by $1,572 higher Gross Margin and lower SG&A of $42 due to reductions of approximately $200 in bad debt expense and $100 in sales and marketing expenses, partly offset by $200 higher wages and benefits.
Adjusted EBITDA
Sub-metering Adjusted EBITDA in the first quarter of 2018 increased by $1,599 or 62% to $4,168, primarily driven by $1,609 of higher EBITDA, partly offset by a $10 decrease in net loss on disposal.
Corporate
|
Three months ended March 31, |
||||
|
(000's) |
2018 |
2017 |
Change |
Percent Change |
|
EBITDA |
$(9,600) |
$(8,224) |
$(1,376) |
(17%) |
|
Adjusted EBITDA |
$(9,600) |
$(8,224) |
$(1,376) |
(17%) |
EBITDA and Adjusted EBITDA
Corporate EBITDA and Adjusted EBITDA in the first quarter of 2018 decreased by $1,376 or 17% to a loss of $9,600, primarily due to approximately $1,100 of higher professional fees mainly driven by the implementation of new ERP and CRM systems, $800 higher office expenses, which includes software licensing costs and $1,550 of higher wages and benefits primarily related to the transfer of IT personnel from Enercare Home Services to Corporate. These increases were partly offset by $2,150 of lower stock-based compensation costs resulting from a decrease in the Share price.
Non-IFRS Measures of Gross Margin and Adjusted EBITDA
The following tables summarize the comparative quarterly results for the last eight quarters and reconcile revenue, an IFRS measure, to Gross Margin and Net Earnings, an IFRS measure, to Adjusted EBITDA.
|
(000's) |
Q1/18 |
Q4/17* |
Q3/17* |
Q2/17* |
Q1/17* |
Q4/16 |
Q3/16 |
Q2/16 |
|
Revenue |
$279,070 |
$290,993 |
$301,103 |
$319,987 |
$248,696 |
$293,246 |
$315,944 |
$244,102 |
|
Cost of goods sold |
128,957 |
136,112 |
140,473 |
150,260 |
109,382 |
144,100 |
163,284 |
109,610 |
|
Gross Margin |
$150,113 |
$154,881 |
$160,630 |
$169,727 |
$139,314 |
$149,146 |
$152,660 |
$134,492 |
|
* As a result of the implementation of IFRS 15, total revenue and cost of goods sold have been restated. |
|
(000's) |
Q1/18 |
Q4/17 |
Q3/17 |
Q2/17 |
Q1/17 |
Q4/16 |
Q3/16 |
Q2/16 |
|
Net earnings/(loss) |
$ 4,854 |
$17,289 |
20,154 |
21,103 |
$(3,032) |
$17,552 |
$19,332 |
$16,051 |
|
Deferred tax (recovery)/expense |
(4,524) |
(45) |
1,929 |
2,017 |
(6,105) |
(5,275) |
(7,522) |
(7,633) |
|
Current tax expense |
6,555 |
5,023 |
5,785 |
6,500 |
5,415 |
11,534 |
15,332 |
15,259 |
|
Amortization expense |
39,811 |
40,667 |
39,457 |
39,485 |
38,399 |
38,892 |
38,329 |
35,796 |
|
Interest expense |
10,333 |
10,302 |
9,798 |
9,763 |
15,844 |
8,554 |
8,507 |
9,187 |
|
EBITDA |
$57,029 |
$73,236 |
$77,123 |
$78,868 |
$50,521 |
$71,257 |
$73,978 |
$68,660 |
|
Add: Net loss on disposal |
1,221 |
444 |
643 |
5,137 |
1,857 |
850 |
734 |
891 |
|
Add: Acquisition/Divestiture SG&A |
481 |
410 |
320 |
273 |
104 |
603 |
4,854 |
5,128 |
|
Adjusted EBITDA |
$58,731 |
$74,090 |
$78,086 |
$84,278 |
$52,482 |
$72,710 |
$79,566 |
$74,679 |
Outlook
The forward-looking statements contained in this section are not historical facts but, rather, reflect Enercare's current expectations regarding future results or events and are based on information currently available to management (see "Cautionary Note Regarding Forward-looking Statements" in this news release).
Enercare remains focused on its strategic objectives of continued growth, operational excellence and innovation. Enercare's financial plan is focused on growing both revenue and Adjusted EBITDA, while remaining committed to providing shareholder value.
In 2018, Enercare expects to continue to grow revenue and Adjusted EBITDA in all three operating segments by focusing on the following key strategic objectives.
Enercare Home Services Key Priorities:
- Grow Rental and protection plan portfolios;
- Invest in technology and innovation to improve the service experience and help differentiate our offerings from those of our competitors;
- Emphasize HVAC rentals over outright sales in order to create a long-term customer revenue stream and provide valuable cross-selling opportunities; and
- Roll out the Enercare Smarter Home solution to enable a proactive, rather than reactive, service model.
Service Experts Key Priorities:
- Integrate rentals throughout Service Experts residential heating and cooling operations by the end of 2018 to create recurring revenue;
- Execute on strategic acquisition opportunities; and
- Generate strong organic sales.
Sub-metering Segment Key Priorities:
- Increase contracted and Billable units.
In the Service Experts business, the percentage of rental HVAC installations in the U.S. continues to rise. The rental proportion of total residential units sold improved in the first quarter of 2018 to approximately 7.2% compared to 2.2% in the first quarter of 2017 and 3.2% in the fourth quarter of 2017. In March 2018, the rental rate was approximately 10% in the U.S. centers which had deployed the rental offering in 2017. We are on track to complete our U.S. rental roll-out by the end of the year.
Enercare has embarked on an ongoing program to increase efficiency and innovation by investing in its systems and technology. Enercare continues to invest in the replacement and modernization of its information technology systems and infrastructure to improve its customer experience and expand its product and service offerings. As these and other innovations are rolled out over the next few years, Enercare will continue making additional investments in both capital and SG&A expenditures.
In addition, Enercare is targeting a range of between $185 million and $207 million in capital investments in 2018, reflecting higher rental originations from Service Experts.
Enercare estimates that it will recognize approximately $26 million to $32 million in current income tax expense for the fiscal year ending December 31, 2018. This estimate assumes corporate tax rates of approximately 26.5% in Canada and 26% in the U.S. Taxable income is principally impacted by changes in revenue, operating expenses, potential acquisitions or divestitures, appropriate tax planning, capital expenditures through the capital cost allowance deduction, changes in tax laws, distribution of sales and earnings by state, and regulations and administrative practices. As additional regulatory guidance is issued by the applicable U.S. taxing authorities, the assumptions used to estimate taxable income in the U.S. may be impacted.
Financial Statements and Management's Discussion and Analysis
Enercare's financial statements for the first quarter ended March 31, 2018 and the MD&A are available on SEDAR at www.sedar.com or on Enercare's investor relations website at Enercare.ca.
Conference Call and Webcast
Management will host a conference call and live audio webcast to discuss Enercare's financial results for the first quarter ended March 31, 2018 this morning at 10:00 a.m. (ET). John Macdonald, President and CEO, and Brian Schmitt, CFO, will review Enercare's results and discuss the quarter's operating highlights.
Those wishing to listen to the teleconference may access the live webcast as follows:
|
Date: |
Friday, May 4, 2018 |
|
Time: |
10:00 a.m. to 11:00 a.m. Eastern Time |
|
Telephone: |
647.427.7450 or 1.888.231.8191 |
|
Please allow 10 minutes to be connected to the conference call. | |
|
Webcast: |
https://event.on24.com/wcc/r/1655304/E24892A377243673FE5DEFEC8C1DE505 |
|
To access the audio webcast please go to the "Investor Relations, Presentations & IR Events" section of enercare.ca. Media Player or Real Player is required to listen to the broadcast. | |
|
A slide presentation for simultaneous viewing with the conference call will be made available at https://corporate.enercare.ca/presentations-ir-events on the morning of the webcast | |
|
Replay: |
The playback will be made available approximately two hours after the event at 416.849.0833 or 855.859.2056, access code: 4085664 |
|
An archived webcast will be available for one year following the original broadcast. |
Cautionary Note Regarding Forward-looking Statements
This news release contains certain forward-looking statements within the meaning of applicable Canadian securities laws ("forward-looking statements" or "forward-looking information") that involve various risks and uncertainties and should be read in conjunction with Enercare's 2017 audited consolidated financial statements and Enercare's condensed interim consolidated financial statements for the three months ended March 31, 2018. Additional information in respect of Enercare, including the Annual Information Form of Enercare dated March 22, 2018, can be found on SEDAR at www.sedar.com.
Statements other than statements of historical fact contained in this news release may be forward-looking statements, including, without limitation, management's expectations, intentions and beliefs concerning anticipated future events, results, circumstances, economic performance or expectations with respect to Enercare, including Enercare's business operations, business strategy and financial condition. When used herein, the words "anticipates", "believes", "budgets", "could", "estimates", "expects", "forecasts", "goal", "intends", "may", "might", "outlook", "plans", "projects", "schedule", "should", "strive", "target", "will", "would" and similar expressions are often intended to identify forward-looking information, although not all forward-looking information contains these identifying words. In particular, statements regarding Enercare's plans for 2018 in the "Outlook" section of this news release are forward-looking statements. These forward-looking statements may reflect the internal projections, expectations, future growth, results of operations, performance, business prospects and opportunities of Enercare and are based on information currently available to Enercare and/or assumptions that Enercare believes are reasonable. Many factors could cause actual results to differ materially from the results and developments discussed in the forward-looking information.
In developing these forward-looking statements, certain material assumptions were made. These forward-looking statements are also subject to certain risks. These risks include, but are not limited to:
- actual future market conditions being different than anticipated by management;
- the risk that the roll out of rental HVAC offerings beyond the present 16 states in the United States does not realize anticipated results as the rental model is a new concept in this industry in the United States; and
- the risks and uncertainties described under "Risk Factors" in the MD&A.
Material factors or assumptions that were applied to drawing a conclusion or making an estimate set out in forward-looking statements include:
- management's views regarding current and anticipated market conditions;
- industry trends remaining unchanged;
- Enercare's financial and operating attributes as at the date hereof and its anticipated future performance;
- assumptions regarding the volume and mix of business activities remaining consistent with current trends; and
- assumptions regarding the interest rate of the two 4-year non-revolving, non-amortizing variable rate term credit facilities in the aggregate amount of US $200,000 and the 2014 Revolver, foreign exchange rates and commodity prices.
There can be no assurance that recent results from the introduction of the rental model to Service Experts in Canada and the United States are indicative of future results. There can also be no assurance as to any potential outcome of the Competition Bureau's inquiry and the effect on Enercare's business.
Readers are cautioned that the preceding list of material factors or assumptions is not exhaustive. Although forward-looking statements contained in this news release are based upon what management believes are reasonable assumptions, there can be no assurance that actual results will be consistent with these forward-looking statements. Accordingly, readers should not place undue reliance on such forward-looking statements and assumptions as management cannot provide assurance that actual results or developments will be realized or, even if substantially realized, that they will have the expected consequences to, or effects on, Enercare. All forward-looking information in this news release is made as of the date of this news release. These forward-looking statements are subject to change as a result of new information, future events or other circumstances, in which case they will only be updated by Enercare where required by law.
About Enercare Inc.
Enercare is headquartered in Markham, Ontario, Canada and is publicly traded on the Toronto Stock Exchange ECI. As one of North America's largest home and commercial services and energy solutions companies with approximately 4,700 employees under its Enercare and Service Experts brands, Enercare is a leading provider of water heaters, water treatment, furnaces, air conditioners and other HVAC rental products, plumbing services, protection plans and related services. With operations in Canada and the United States, Enercare serves approximately 1.6 million customers annually. Enercare is also the largest non-utility sub-meter provider, with electricity, water, thermal and gas metering contracts for condominium and apartment suites in Canada and through its Triacta Power Technologies Inc. brand, a premier designer and manufacturer of advanced sub-meters and sub-metering solutions.
For more information on Enercare visit enercare.ca. Additional information regarding Enercare is available through our investor relations website at corporate.enercare.ca or on SEDAR at www.sedar.com. Subscribe to our email alerts at corporate.enercare.ca/email-alerts to receive our news releases electronically.
")


SOURCE Enercare Inc.


View original content with multimedia: http://www.newswire.ca/en/releases/archive/May2018/04/c1914.html
© 2024 Benzinga.com. Benzinga does not provide investment advice. All rights reserved.
Trade confidently with insights and alerts from analyst ratings, free reports and breaking news that affects the stocks you care about.

