


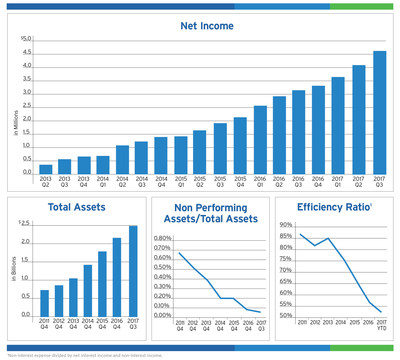
BELMONT, Mass., Oct. 19, 2017 /PRNewswire/ -- BSB Bancorp, Inc. BLMT (the "Company"), the holding company for Belmont Savings Bank (the "Bank"), a state-chartered savings bank headquartered in Belmont, Massachusetts, today reported a 44.6% increase in net income to $4.60 million or $0.50 per diluted share for the quarter ended September 30, 2017 compared to net income of $3.18 million or $0.35 per diluted share for the quarter ended September 30, 2016. This is the Bank's 17th consecutive quarter of earnings growth. For the nine months ended September 30, 2017, the Company reported net income of $12.28 million or $1.33 per diluted share as compared to net income of $8.67 million or $0.97 per diluted share for the nine months ended September 30, 2016 or an increase in net income of 41.6%.
Robert M. Mahoney, President and Chief Executive Officer, said, "Our team continued to execute our strategy and delivered good growth by all measures. We are extremely proud to have been nationally recognized for our growth in revenue, assets, earnings and shareholder return. We received the prestigious 2017 Sandler O'Neill Sm-All Star Award for being a top 10% performer among over 400 small-cap banks and thrifts across the country. We were the only Massachusetts bank to achieve this award. Also, we had the honor of being ranked 41st on Fortune Magazine's 100 Fastest Growing Companies List in 2017. Here, we were compared to every company on a U.S. stock exchange. We are one of only 7 savings banks nationwide to be named to this prestigious list."


NET INTEREST AND DIVIDEND INCOME
Net interest and dividend income before provision for loan losses for the quarter ended September 30, 2017 was $14.18 million as compared to $12.03 million for the quarter ended September 30, 2016 or a 17.9% increase. The provision for loan losses for the quarter ended September 30, 2017 was $535,000 as compared to $443,000 for the quarter ended September 30, 2016 or a 20.8% increase. The combination of these items resulted in an increase of $2.06 million or 17.8% in net interest and dividend income after provision for loan losses for the quarter ended September 30, 2017 as compared to the quarter ended September 30, 2016. Net interest and dividend income before provision for loan losses for the nine months ended September 30, 2017 was $41.39 million as compared to $35.02 million for the nine months ended September 30, 2016 or an 18.2% increase. The provision for loan losses for the nine months ended September 30, 2017 was $2.07 million as compared to $1.78 million for the nine months ended September 30, 2016 or a 16.1% increase. The combination of these items resulted in an increase of $6.09 million or 18.3% in net interest and dividend income after provision for loan losses for the nine months ended September 30, 2017 as compared to the nine months ended September 30, 2016.
NONINTEREST INCOME
Noninterest income for the quarter ended September 30, 2017 was $885,000 as compared to $680,000 for the quarter ended September 30, 2016 or an increase of 30.1%.
- Customer service fees decreased $37,000 or 15.3% primarily due to declines in NSF and other fees.
- Net gains on sales of loans increased $242,000 or 968.0% due to an increase in the number of loans sold.
- Loan servicing fee income increased $22,000 or 44.9% due to both an increase in the balance of loans that we service for others as well as an improvement in the value of our mortgage servicing right asset.
- Other income decreased by $16,000 or 22.5% primarily due to a decrease in other loan related fee income.
Noninterest income for the nine months ended September 30, 2017 was $2.51 million as compared to $2.05 million for the nine months ended September 30, 2016 or an increase of 22.6%.
- Customer service fees decreased $105,000 or 15.2% primarily due to declines in NSF and other fees.
- Income from bank-owned life insurance increased $72,000 or 9.4% primarily due to a purchase of $5.00 million in additional bank-owned life insurance policies at the end of the second quarter of 2016.
- Net gains on sales of loans increased $422,000 or 220.9% due to an increase in the number of loans sold.
- Loan servicing fee income increased $35,000 or 13.8% due to an improvement in the value of our mortgage servicing right asset.
- Other income increased by $38,000 or 25.3% primarily due to increases in the values of investments held in a Rabbi Trust. Investments held in the Rabbi Trust are used to fund the executive and director non-qualified deferred compensation plan. Corresponding deferred compensation expense is recorded within director compensation and salaries and employee benefits.
NONINTEREST EXPENSE
Noninterest expense for the quarter ended September 30, 2017 was $7.93 million as compared to $7.07 million for the quarter ended September 30, 2016 or an increase of 12.2%.
- Salaries and employee benefits increased $812,000 or 18.3% driven by cash-based incentive compensation, stock-based compensation related to grants of restricted stock made during the first quarter of 2017 and a slight increase in the number of employees.
- Director compensation increased $56,000 or 18.4% primarily driven by stock-based compensation related to grants of restricted stock made during the first quarter of 2017.
- Deposit insurance expense increased by $110,000 or 34.2% primarily driven by asset growth.
- Professional fees decreased by $39,000 or 15.1% primarily due to a decrease in consultant fees.
- Marketing costs decreased by $42,000, or 19.1% primarily due to a higher proportion of our marketing budget being utilized in the first half of 2017 as part of the digital promotion of our market leading consumer lending products as well as additional support for our business banking segment strategy.
Noninterest expense for the nine months ended September 30, 2017 was $23.05 million as compared to $21.31 million for the nine months ended September 30, 2016 or an increase of 8.2%.
- Salaries and employee benefits increased $1.33 million or 9.9% driven by stock-based compensation related to grants of restricted stock made during the first quarter of 2017, cash-based incentive compensation and a slight increase in the number of employees.
- Director compensation increased $234,000 or 29.8% primarily driven by stock-based compensation related to grants of restricted stock made during the first quarter of 2017.
- Deposit insurance expense increased by $361,000 or 40.6% primarily driven by asset growth and the FDIC's new assessment methodology that was first effective for the quarter ended September 30, 2016.
- Data processing fees decreased by $378,000 or 15.5% as we renegotiated certain contracts with service providers in late 2016.
- Professional fees increased by $98,000 or 14.4% primarily due to the timing of certain annual audit engagements as well as increased attorney and consultant fees.
- Marketing costs increased by $91,000, or 14.0% primarily due to an increase in digital promotion of our market leading consumer lending products as well as additional support for our business banking segment strategy.
Our efficiency ratio improved to 52.6% for the quarter ended September 30, 2017 from 55.6% for the quarter ended September 30, 2016 and to 52.5% for the nine months ended September 30, 2017 from 57.5% for the nine months ended September 30, 2016 as we continue to grow the balance sheet and manage costs. A talented and committed colleague team along with continued operational enhancements have contributed to the improvement in our efficiency ratio.
INCOME TAXES
We recorded a provision for income taxes of $2.00 million for the quarter ended September 30, 2017, compared to a provision for income taxes of $2.02 million for the quarter ended September 30, 2016, reflecting effective tax rates of 30.3% and 38.8%, respectively. We recorded a provision for income taxes of $6.50 million for the nine months ended September 30, 2017, compared to a provision for income taxes of $5.3 million for the nine months ended September 30, 2016, reflecting effective tax rates of 34.6% and 38.0%, respectively. In both the quarter over quarter and year over year comparisons, the decrease in our effective tax rate was driven by tax benefits related to stock-based compensation.
BALANCE SHEET
At September 30, 2017, total assets were $2.50 billion, an increase of $340.99 million or 15.8% from $2.16 billion at December 31, 2016. The Company experienced net loan growth of $306.06 million or 16.4% from December 31, 2016 to September 30, 2017. 1-4 family residential real estate loans and commercial real estate loans increased by $239.95 million and $113.04 million, respectively. Partially offsetting these increases were a decrease in construction loans of $24.70 million and a decrease in indirect auto loans of $24.24 million. The decrease in indirect auto loans was driven by the suspension of new originations due to current market conditions. The asset growth was primarily funded by growth in deposits and Federal Home Loan Bank advances.
At September 30, 2017, deposits totaled $1.71 billion, an increase of $245.34 million or 16.7% from $1.47 billion at December 31, 2016. Core deposits, which we consider to include all deposits other than CDs, increased by $130.40 million or 11.5% from $1.13 billion at December 31, 2016 to $1.26 billion at September 30, 2017. Hal R. Tovin, Executive Vice President and Chief Operating Officer, said "Consistent execution providing competitive retail deposit products, targeted business banking offerings and commercial relationship expansion continues to create new and existing customer deposit growth."
Total stockholders' equity increased by $14.64 million or 9.1% from $160.92 million as of December 31, 2016 to $175.56 million as of September 30, 2017. This increase is primarily the result of earnings of $12.28 million and a $2.17 million increase in additional paid-in capital related to stock-based compensation.
ASSET QUALITY
Asset quality remains strong. The allowance for loan losses in total and as a percentage of total loans as of September 30, 2017 was $15.62 million and 0.72%, respectively, as compared to $13.59 million and 0.73%, respectively, as of December 31, 2016. For the nine months ended September 30, 2017, the Company recorded net charge offs of $35,000, as compared to net charge offs of $54,000 for the nine months ended September 30, 2016. Total non-performing assets were $1.64 million or 0.07% of total assets as of September 30, 2017 as compared to $1.82 million or 0.08% of total assets as of December 31, 2016.
Company Profile
BSB Bancorp, Inc. is headquartered in Belmont, Massachusetts and is the holding company for Belmont Savings Bank. The Bank provides financial services to individuals, families, municipalities and businesses through its six full-service branch offices located in Belmont, Watertown, Cambridge, Newton and Waltham in Southeast Middlesex County, Massachusetts. The Bank's primary lending market includes Essex, Middlesex, Norfolk and Suffolk Counties, Massachusetts. The Company's common stock is traded on the NASDAQ Capital Market under the symbol "BLMT." For more information, visit the Company's website at www.belmontsavings.com.
Forward-looking statements
Certain statements herein constitute "forward-looking statements" within the meaning of Section 27A of the Securities Act of 1933 and Section 21E of the Securities Exchange Act of 1934, as amended. These statements are based on the beliefs and expectations of management, as well as the assumptions made using information currently available to management. Since these statements reflect the views of management concerning future events, these statements involve risks, uncertainties and assumptions. As a result, actual results may differ from those contemplated by these statements. Forward-looking statements can be identified by the fact that they do not relate strictly to historical or current facts. They often include words like "believe," "expect," "anticipate," "estimate," and "intend" or future or conditional verbs such as "will," "would," "should," "could" or "may." Certain factors that could cause actual results to differ materially from expected results include changes in the interest rate environment, changes in general economic conditions, the Company's ability to continue to increase loans and deposit growth, legislative and regulatory changes that adversely affect the businesses in which the Company is engaged, changes in the securities market, and other factors that are described in the Company's annual report on Form 10-K and quarterly reports on Form 10-Q as filed with the Securities and Exchange Commission. Readers are cautioned not to place undue reliance on these forward-looking statements, which speak only as of the date of this release. The Company disclaims any intent or obligation to update any forward-looking statements, whether in response to new information, future events or otherwise, except as may be required by law.
|
BSB BANCORP, INC. AND SUBSIDIARIES | |||||||
|
CONSOLIDATED BALANCE SHEETS | |||||||
|
(Dollars in thousands, except share and per share data) | |||||||
|
September 30, 2017 |
December 31, 2016 | ||||||
|
(unaudited) |
|||||||
|
ASSETS |
|||||||
|
Cash and due from banks |
$ 1,788 |
$ 2,211 | |||||
|
Interest-bearing deposits in other banks |
74,658 |
56,665 | |||||
|
Cash and cash equivalents |
76,446 |
58,876 | |||||
|
Interest-bearing time deposits with other banks |
2,440 |
234 | |||||
|
Investments in available-for-sale securities |
22,108 |
22,048 | |||||
|
Investments in held-to-maturity securities (fair value of $138,701 as of |
|||||||
|
September 30, 2017 and $129,465 as of December 31, 2016) |
139,291 |
130,197 | |||||
|
Federal Home Loan Bank stock, at cost |
28,317 |
25,071 | |||||
|
Loans held for sale |
642 |
- | |||||
|
Loans, net of allowance for loan losses of $15,620 as of |
|||||||
|
September 30, 2017 and $13,585 as of December 31, 2016 |
2,172,099 |
1,866,035 | |||||
|
Premises and equipment, net |
2,314 |
2,355 | |||||
|
Accrued interest receivable |
5,711 |
4,635 | |||||
|
Deferred tax asset, net |
8,803 |
8,321 | |||||
|
Income taxes receivable |
13 |
423 | |||||
|
Bank-owned life insurance |
36,681 |
35,842 | |||||
|
Other assets |
4,833 |
4,667 | |||||
|
Total assets |
$ 2,499,698 |
$ 2,158,704 | |||||
|
LIABILITIES AND STOCKHOLDERS' EQUITY |
|||||||
|
Deposits: |
|||||||
|
Noninterest-bearing |
$ 201,357 |
$ 208,082 | |||||
|
Interest-bearing |
1,513,406 |
1,261,340 | |||||
|
Total deposits |
1,714,763 |
1,469,422 | |||||
|
Federal Home Loan Bank advances |
587,250 |
508,850 | |||||
|
Securities sold under agreements to repurchase |
1,861 |
1,985 | |||||
|
Accrued interest payable |
1,434 |
1,023 | |||||
|
Deferred compensation liability |
7,694 |
7,043 | |||||
|
Other liabilities |
11,135 |
9,460 | |||||
|
Total liabilities |
2,324,137 |
1,997,783 | |||||
|
Stockholders' Equity: |
|||||||
|
Common stock; $0.01 par value per share, 100,000,000 shares authorized; 9,714,775 and 9,110,077 |
|||||||
|
shares issued and outstanding at September 30, 2017 and December 31, 2016, respectively |
97 |
91 | |||||
|
Additional paid-in capital |
94,186 |
92,013 | |||||
|
Retained earnings |
84,776 |
72,498 | |||||
|
Accumulated other comprehensive income |
172 |
103 | |||||
|
Unearned compensation - ESOP |
(3,670) |
(3,784) | |||||
|
Total stockholders' equity |
175,561 |
160,921 | |||||
|
Total liabilities and stockholders' equity |
$ 2,499,698 |
$ 2,158,704 | |||||
|
Asset Quality Data: |
|||||||
|
Total non-performing assets |
$ 1,644 |
$ 1,822 | |||||
|
Total non-performing loans |
$ 1,626 |
$ 1,819 | |||||
|
Non-performing loans to total loans |
0.07% |
0.10% | |||||
|
Non-performing assets to total assets |
0.07% |
0.08% | |||||
|
Allowance for loan losses to non-performing loans |
960.64% |
746.84% | |||||
|
Allowance for loan losses to total loans |
0.72% |
0.73% | |||||
|
Share Data: |
|||||||
|
Outstanding common shares |
9,714,775 |
9,110,077 | |||||
|
Book value per share |
$ 18.07 |
$ 17.66 | |||||
|
Consolidated Capital Ratios: |
|||||||
|
Common Equity Tier 1 Risk-Based Capital Ratio |
10.59% |
10.80% | |||||
|
Tier 1 Risk-Based Capital Ratio |
10.59% |
10.80% | |||||
|
Total Risk-Based Capital Ratio |
11.53% |
11.72% | |||||
|
Leverage Ratio |
7.28% |
7.63% | |||||
|
BSB BANCORP, INC. AND SUBSIDIARIES | |||||||||||
|
CONSOLIDATED STATEMENTS OF OPERATIONS | |||||||||||
|
(Dollars in thousands, except per share data) | |||||||||||
|
Three months ended |
Nine months ended | ||||||||||
|
September 30, |
September 30, | ||||||||||
|
2017 |
2016 |
2017 |
2016 | ||||||||
|
(unaudited) |
(unaudited) | ||||||||||
|
Interest and dividend income: |
|||||||||||
|
Interest and fees on loans |
$ 18,432 |
$ 14,696 |
$ 52,328 |
$ 42,247 | |||||||
|
Interest on taxable debt securities |
836 |
784 |
2,469 |
2,413 | |||||||
|
Dividends |
320 |
193 |
866 |
534 | |||||||
|
Other interest income |
170 |
53 |
365 |
136 | |||||||
|
Total interest and dividend income |
19,758 |
15,726 |
56,028 |
45,330 | |||||||
|
Interest expense: |
|||||||||||
|
Interest on deposits |
3,391 |
2,427 |
8,992 |
6,899 | |||||||
|
Interest on Federal Home Loan Bank advances |
2,187 |
1,271 |
5,645 |
3,407 | |||||||
|
Interest on securities sold under agreements to repurchase |
1 |
1 |
3 |
3 | |||||||
|
Interest on other borrowed funds |
- |
- |
- |
5 | |||||||
|
Total interest expense |
5,579 |
3,699 |
14,640 |
10,314 | |||||||
|
Net interest and dividend income |
14,179 |
12,027 |
41,388 |
35,016 | |||||||
|
Provision for loan losses |
535 |
443 |
2,070 |
1,783 | |||||||
|
Net interest and dividend income after provision |
|||||||||||
|
for loan losses |
13,644 |
11,584 |
39,318 |
33,233 | |||||||
|
Noninterest income: |
|||||||||||
|
Customer service fees |
205 |
242 |
586 |
691 | |||||||
|
Income from bank-owned life insurance |
287 |
293 |
834 |
762 | |||||||
|
Net gain on sales of loans |
267 |
25 |
613 |
191 | |||||||
|
Loan servicing fee income |
71 |
49 |
288 |
253 | |||||||
|
Other income |
55 |
71 |
188 |
150 | |||||||
|
Total noninterest income |
885 |
680 |
2,509 |
2,047 | |||||||
|
Noninterest expense: |
|||||||||||
|
Salaries and employee benefits |
5,257 |
4,445 |
14,732 |
13,404 | |||||||
|
Director compensation |
361 |
305 |
1,020 |
786 | |||||||
|
Occupancy expense |
242 |
250 |
741 |
742 | |||||||
|
Equipment expense |
100 |
112 |
327 |
326 | |||||||
|
Deposit insurance |
432 |
322 |
1,250 |
889 | |||||||
|
Data processing |
674 |
679 |
2,062 |
2,440 | |||||||
|
Professional fees |
220 |
259 |
779 |
681 | |||||||
|
Marketing |
178 |
220 |
739 |
648 | |||||||
|
Other expense |
465 |
474 |
1,399 |
1,389 | |||||||
|
Total noninterest expense |
7,929 |
7,066 |
23,049 |
21,305 | |||||||
|
Income before income tax expense |
6,600 |
5,198 |
18,778 |
13,975 | |||||||
|
Income tax expense |
2,001 |
2,018 |
6,500 |
5,304 | |||||||
|
Net income |
$ 4,599 |
$ 3,180 |
$ 12,278 |
$ 8,671 | |||||||
|
Earnings per share |
|||||||||||
|
Basic |
$ 0.52 |
$ 0.36 |
$ 1.39 |
$ 1.00 | |||||||
|
Diluted |
$ 0.50 |
$ 0.35 |
$ 1.33 |
$ 0.97 | |||||||
|
Return on average assets |
0.76% |
0.63% |
0.71% |
0.60% | |||||||
|
Return on average equity |
10.51% |
8.12% |
9.74% |
7.62% | |||||||
|
Interest rate spread |
2.21% |
2.29% |
2.27% |
2.34% | |||||||
|
Net interest margin |
2.36% |
2.43% |
2.41% |
2.48% | |||||||
|
Efficiency ratio |
52.64% |
55.61% |
52.51% |
57.48% | |||||||
|
Contact: |
Robert M. Mahoney |
|||
|
President and Chief Executive Officer |
||||
|
Phone: |
617-484-6700 |
|||
|
Email: |
View original content with multimedia:http://www.prnewswire.com/news-releases/bsb-bancorp-inc-reports-third-quarter-results---year-over-year-earnings-growth-of-42-300540105.html
SOURCE BSB Bancorp, Inc.


© 2024 Benzinga.com. Benzinga does not provide investment advice. All rights reserved.
Trade confidently with insights and alerts from analyst ratings, free reports and breaking news that affects the stocks you care about.

