


This post contains sponsored advertising content. This content is for informational purposes only and not intended to be investing advice.
(Tuesday Market Open) Equity index futures turned bullish in the wee hours and were pointing to a higher open on news that Russian President Vladimir Putin would be pulling some troops back from the border. Before the release of the hotter-than-expected Producer Price Index (PPI), futures were pointing to a sharply higher open.
Igor Konashenkov of the Russian defense ministry released a statement that said that some of the Russian troops stationed along the Ukrainian border were returning to their bases. Additionally, troops performing drills in neighboring Belarus were already scheduled to leave February 20. The United States has yet to confirm any movements, but futures traders appear to be taking Russia at its word.
There are other bullish signs outside of equity index futures in premarket trading. The Cboe Market Volatility Index (VIX) has dropped to about 26, and crude oil futures have fallen to more than 3%. These are good signs for stocks, but that first 30 minutes of trading will mean a lot if the bulls can hold. In the past week, we’ve seen support on the S&P 500 (SPX) around 4425 and resistance around 4470. These could be signals if investors are in “risk on” or “risk off” mode.
The Producer Price Index (PPI) reported inflation at the wholesale level grew at a much faster pace than expected, growing 1% in January—well above the forecasted target of 0.5%. It also grew at 9.7% year over year above the estimate of 9.1%. Many economists are hoping this is peak inflation and the economy will start to turn around soon, but reports have been consistently hotter each month since October. As we move into a large group of retailers reporting earnings, the ability to pass on higher costs could be a bigger issue for these companies. Investors appeared to initially shrug the news off.
Buying and Selling Trends
The TD Ameritrade Investors Movement Index (IMX) revealed TD Ameritrade clients were net equity buyers in January. They were bucking some market trends as they appeared to favor technology, communication, and consumer discretionary stocks while selling industrials, energy, and utilities. Clients appeared to be doing some bargain hunting in big tech, focusing on Nvidia NVDA, Microsoft MSFT, and Apple AAPL to name a few. They sold travel and leisure stocks like Carnival CCL, Royal Caribbean RCL, American Airlines (NASDAQ: AAL), Wynn Resorts WYNN along with several others.
Stocks continued to fall on Monday in reaction to rising tension and conflicting headlines over the standoff between Russia, Ukraine, and Ukraine allies. The tension isn’t just around Eastern European conflicts, inflation and interest rate tensions are also holding stocks back as St. Louis Fed President James Bullard defended his comments last week in an interview on CNBC. Despite the fear and uncertainty, stocks were able to battle back on Monday with a late-day rally that trimmed most of the losses.
The Dow Jones Industrial Average ($DJI) was the biggest loser on the day, closing 0.49% lower. However, the Dow was down about 1.25% earlier in the day before rallying back. Likewise, the S&P 500 (SPX) was down about 1.2% before rallying to close 0.36% lower. The Nasdaq Composite ($COMP) showed greater strength than the other two major indices; it was down about 0.85% and then rallied to close at breakeven on the day. The Cboe Market Volatility Index (VIX) rallied early in the day, spiking above 32 but retraced to just above 28.
Oil prices were also all over the place, falling almost 2% lower, then rallying nearly 2%, and finally closing 1.8% higher on the day. The 10-year Treasury yield (TNX) was also volatile in reaction to the day’s news. It opened the day at 1.99%, ran up to 2.03%, and then sold off to close at 1.99%.
In order to get through the volatility and uncertainty, investors appear to be turning to gold. Gold futures rose 1.68%, adding to Friday’s 1.8% gains. Despite its own volatility issues, gold futures are up about 4% year to date and have gained in relative strength against the S&P 500 (SPX) over the same time frame.
Unpacking the Russian Doll
One reason for the volatility was the conflicting messages over Russia and Ukraine. Before Monday’s open, Russian Foreign Minister Sergei Lavrov suggested there was still a diplomatic way out of the current situation with the Russian troop buildup near the Ukrainian border.
At midday, the media appeared to misunderstand the sarcastic tone of Ukraine President Zelensky, according to Briefing.com. President Zelensky was trying to be “tongue in cheek” when he claimed that Russia would be attacking on February 16 and that he would declare it a national holiday. The news caused oil prices and yields to rise, while pushing stocks lower.
However, markets appeared to recognize the mistake and pulled back. In the end, the United States did decide to close its embassy in Kyiv and move it to Western Ukraine.
Bullard in a China Shop
In response to the hotter-than-expected Consumer Price Index (CPI) report last Thursday, St. Louis Federal Reserve President James Bullard commented that he would like to see the overnight rate raised to 1% by July. While the market reacted negatively to the CPI report, it really sold off after his comments. On Monday morning, Mr. Bullard had another interview on CNBC where he defended his comments that the Fed needs to be more aggressive in attacking inflation.
President Bullard acknowledged that he was only one member of the Fed committee, but he still plans to push for higher rates sooner rather than later. He cited that each CPI report from October 2021 to January 2022 has been worse than expected and expressed concern that the situation could create a systemic problem of rising inflation that the Fed may not be able to manage in the future. He felt that the Fed could manage the current situation without disrupting the markets too much, but he expressed concern that the Fed’s credibility is on the line if it doesn’t act.
Several other Fed members will be speaking this week, which will likely attract more attention as investors try to determine which way the committee will swing in March. Additionally, the Federal Open Market Committee (FOMC) meeting minutes are scheduled for release this Thursday.
Earnings Update
Inflation isn’t just showing up in last week’s CPI report; it’s also a common theme in earnings calls. According to FactSet, 75% of S&P 500 companies have cited inflation on their Q4 earnings calls as of Friday. Of the index’s 500 companies, 337 have reported and 246 of them mentioned inflation. The consumer staples and materials sectors have had the highest percentage of companies mentioning “inflation” with 100% of consumer staples companies using the key word.
One reason this is important is because inflation may be causing companies to revise their earnings forecasts. When comparing the current profit margin estimate against the estimates on December 31, margin expectations are lower. The December 31 estimates for Q1 2022 were 12.4% but are now 12.3%. Similarly, the 2022 calendar year estimate was 12.8% but is now 12.7%.
Earnings data from Refinitiv provides other insights for investors. The energy sector remains the hottest sector for earnings growth. Currently, Q4 earnings are on track for 31% earnings growth year over year, but when you remove energy from the mix, the number is 22.6%. Revenue growth is on track for 14.5% year over year, but without energy, it’s just 10.3%.
Most companies are still beating earnings estimates—just not by as much as they did last year. Of the S&P 500 companies that had reported earnings by February 11, 78.2% beat estimates. This is higher than the long-term average of 65.9% but lower than the previous four quarters, which was 83.9%.
Finally, energy and materials continue to be the top sectors for earnings growth for Q4 2021, but industrials are looking to upset materials in Q1 2022. Currently, the industrials sector has the second highest estimated earnings growth rate for Q1—behind energy.
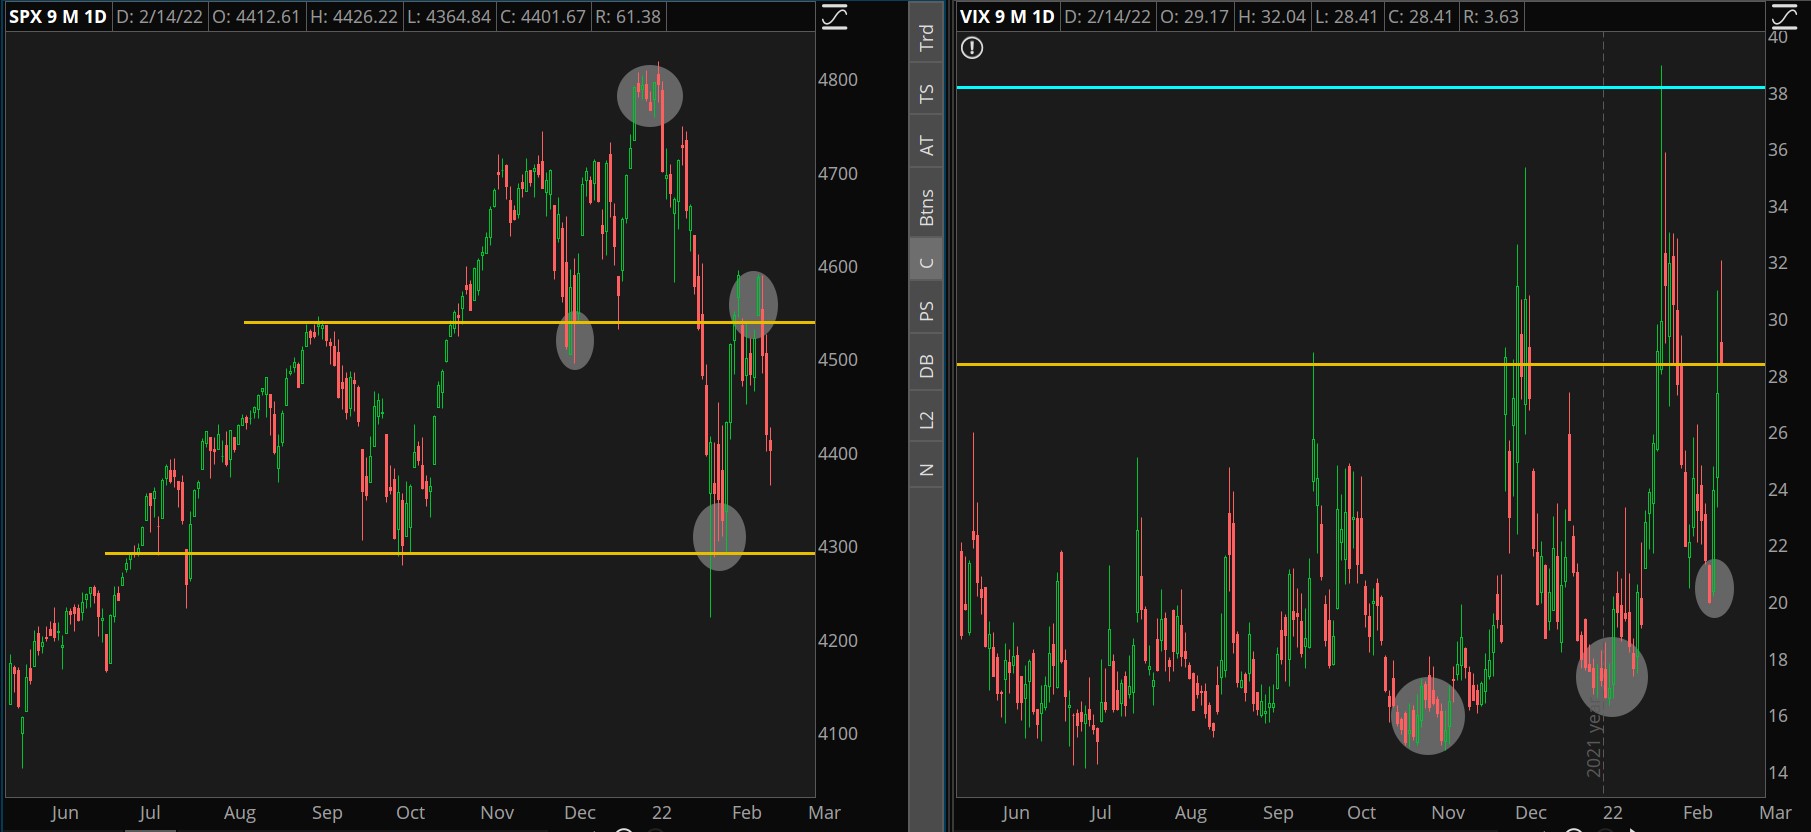
CHART OF THE DAY: SPOTTING REVERSALS. The S&P 500 (SPX—left) has created a lower low and a lower high, which could signal a change in the trend. The Cboe Volatility Index (VIX—right) has created higher lows, which may be seen by some traders as a confirmation the changing trend. Data Sources: ICE, S&P Dow Jones Indices. Chart source: The thinkorswim® platform. For illustrative purposes only. Past performance does not guarantee future results.
Charting Ups & Downs: According to my technical analysis friends, an uptrend is defined as a series of higher lows and higher highs, whereas a downtrend is a series of lower lows and lower highs. With those basic definitions in mind, the S&P 500 (SPX) is exhibiting some concerning price movement for the bulls because of the changes in highs and lows in the index. However, the SPX appears to have an important level of support at 4300. If that level of support holds, it could be that the market’s change in direction may be sideways instead of down.
In Monday’s “Chart of the Day” we saw that the Cboe Market Volatility Index (VIX) appears to be increasing. This could signal rising fear among investors because the VIX has created higher lows in recent months. It has also broken its short-term reversal line in favor of a longer-term reversal line.
Dashboard Lights: In his interview with CNBC Monday morning, St. Louis Fed President James Bullard referred to the Federal Reserve Bank or Atlanta’s Underlying Inflation Dashboard as a tool to help people understand how bad inflation has become. The dashboard pulls data from the CPI, Personal Consumption Expenditures (PCE) Price Index, and Stock and Watson.
After including the latest CPI data, each measure of inflation on the dashboard is in red. The red color signifies that the measure is more than 0.50 ppt above the target. In fact, many indicators are about twice their targets. Of course, there is another month’s worth of inflation information before the Fed meets in March, so investors will be looking for signs of inflation slowing.
IPO or IP-No: Companies looking to go public are withdrawing at the highest pace in history. January set a new record for IPO withdrawals with 22 potential IPOs deciding against going public. Uncertainty around the current business environment appears to have scared off these companies, which are likely afraid they may not raise the capital they want. Many of these companies are special purpose acquisition companies, or SPACs, which have fallen in popularity over the last year.
IPOs actually add to the supply of shares in the market and can have downward pull on prices. So, IPOs are best released when demand for shares is high. With stocks struggling, it could be helpful that fewer shares are being added.
TD Ameritrade® commentary for educational purposes only. Member SIPC.
This post contains sponsored advertising content. This content is for informational purposes only and not intended to be investing advice.
© 2024 Benzinga.com. Benzinga does not provide investment advice. All rights reserved.
Date | ticker | name | Actual EPS | EPS Surprise | Actual Rev | Rev Surprise |
|---|
Trade confidently with insights and alerts from analyst ratings, free reports and breaking news that affects the stocks you care about.

