


Investors probably look forward to Friday more than usual this week.
That’s because Friday is the start of a new month, ending what’s been a disappointing and ugly September that got uglier Tuesday as rising Treasury yields and a volatile situation in Washington took their collective tolls.
September is now on pace to be the worst month for the S&P 500 Index (SPX) since last October. The index is down more than 3% month-to-date. It’s also a reminder of how rising Treasury yields and worries about rising rates can punish the “growth” sectors like Tech and Communication Services. Investors may remember similar times earlier this year and back in the fall of 2018 when rate worries led to tough times for Tech.
These worries also helped send volatility straight back up toward where it was a little over a week ago during the last major selloff. The Cboe Volatility Index (VIX) topped 23 today, up from around 18 at the end of last week. Typically, it’s pivoted near 20 the last few months, and anything that approaches 25 could signal growing worries about more turbulence ahead. At 20 you start to take notice of VIX, and a VIX of 30 can send a strong bearish signal.
In what could be a bearish development going into Wednesday, a little comeback about an hour before the close met new selling pressure that brought the major indices back within shouting distance of their intraday lows. The late selling could suggest an interesting first half hour tomorrow morning if more sell orders remain to be processed. What happens after that could set the tone.
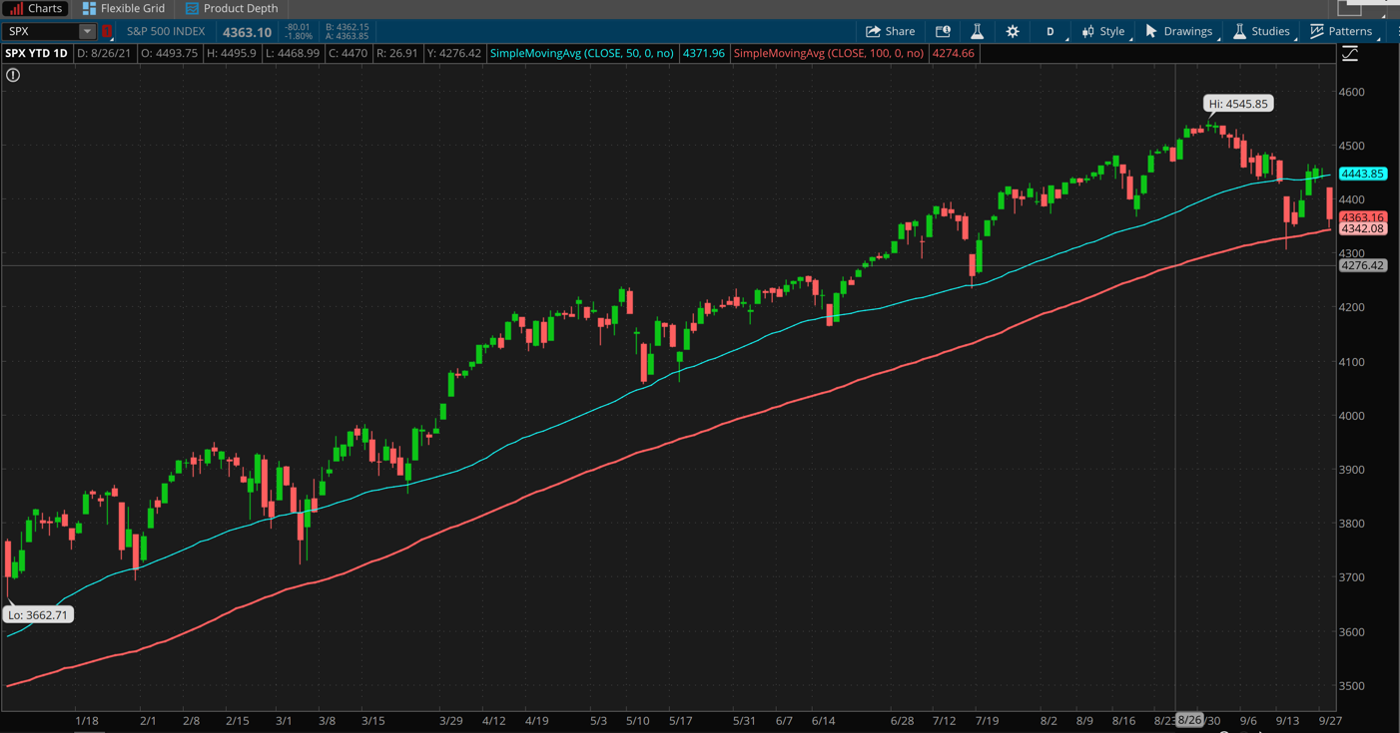
CHART OF THE DAY: 50 TO 100 ACCELERATION. Tuesday saw the S&P 500 Index (SPX—candlestick) slide below its 50-day moving average (blue line) for the second time in six sessions. It’s also approaching its 100-day moving average (red line), a level it’s hardly touched all year. Sometimes these moving averages can represent potential psychological support for the market. Data Source: S&P Dow Jones Indices. Chart source: The thinkorswim® platform. For illustrative purposes only. Past performance does not guarantee future results.
10-Year Yield Gets the Headlines, but Others Are Up Even More
Everyone appears to have their eye on the 10-year Treasury yield, now above 1.5% and at three-month highs. It’s up an amazing 24 basis points in less than a week.
But two-year and five-year yields are also rising. At 1.02%, the five-year yield is up an incredible 183% year-to-date, outpacing the 68% rise of the 10-year yield this year. That means the “curve” between the two is narrowing, though still relatively wide. As they say in England, “Mind the gap,” because if the curve continues to narrow, it may suggest a rougher road ahead for the economy.
Another sign of tough sledding could be more technical, meaning softness on the charts. The SPX fell well below its 50-day moving average of 4342 on Tuesday, the second time that’s happened in the last seven sessions. Though last week it bounced right back amid some “buy the dip” action, that could be harder in coming days considering how rising yields are hurting the Tech sector.
Data-wise, the day wasn’t helped by U.S. consumer confidence, which showed an unexpected slump to a seven-month low due to worries about the Delta variant and inflation, according to the Conference Board. Many technical analysts use consumer confidence as an indicator of the overall market. One month doesn’t make a trend, but it’s certainly something to keep an eye on.
Overall, the selloff Tuesday was pretty orderly, which could be seen as a good thing. There didn’t appear to be any panic. Also, it was interesting to see how broad-based the selling was across markets. Stocks were down, but so were bonds, gold, crude, and even agricultural commodities like corn and soybeans. Crude came within 20 cents a barrel of its July high above $76 and then got beaten back down. One of the only green spots was the U.S. dollar, which could be drawing some strength from a more hawkish-sounding Fed.
It felt like a bit of an asset reset as people tried to figure out what to do ahead of a key infrastructure vote in Congress Thursday and as Fed Chairman Jerome Powell warned Congress today that inflation caused by supply bottlenecks has lasted longer than expected. Today’s selling almost felt like a purge, if you will, but it will be interesting to see if “buy the dip” happens again.
The SPX is now not far above its 100-day moving average of 4342 (see chart above). That level might be where you see some psychological support, but that support would probably melt away on any serious move below it.
Tech Tumbles Hard as 10-Year Yield Spikes
The Nasdaq 100 (NDX) took a nasty fall, down 2.8% with some of the largest Tech names dragging down the broader market. Tech behemoth Microsoft MSFT dropped about 3% while Apple AAPL declined around 2%. While Facebook FB entered deeper negative territory, down 3.3%,
But chipmakers like Nvidia NVDA and Advanced Micro Devices AMD arguably took the worst punishment, plunging more than 4% and 5% respectively. Applied Materials AMAT got smacked, falling 6%. Semiconductors were the hardest hit among all industries in Tech.
Although the Communications sector took the brunt of the beating in today’s session and Tech finished second to last, you’re probably wondering why there seems to be a “tech wreck” every time 10-year Treasury yields spike. The most common answer is that Tech stocks, like all stocks, are in competition with bond yields. The market’s like a discounting mechanism. Investors have to ask themselves whether they’ll get more bang for their buck over the next year investing in bonds or Tech stocks. Bond yields will tell you exactly how much you expect to earn over a period of time.
When it comes to Tech stocks, their values rest on their earnings potential, which is more uncertain, especially if you consider the fact that Tech has far outperformed every sector over the last five to 10 years. Plus you’ve got the inflation factor to consider, which not only erodes the value of the dollar but adds even more uncertainty to the Tech earnings speculation.
Keep in mind that because of Tech’s heavy weighting in the SPX, it has a bigger impact than any other sector on the overall index. So, as CNBC rightly pointed out this morning, strength in lower-weighted sectors like Energy may help individual stocks, but won’t lend much help to the overall index.
A Few Bright Spots on an Ugly Day
And there was some strength to be found, or at least some stability, in parts of the market Tuesday.
A few of the Dow Jones Industrial Average ($DJI) stocks of old like Ford F and General Electric GE were hanging in there. Energy also held up decently despite crude being down. And while some bank stocks like Wells Fargo WFC and Morgan Stanley MS got pounded, others like Bank of America BAC and JP Morgan Chase JPM were near unchanged. Energy and Financials are sectors that tend to do better in an inflationary environment, which might help explain their recent resilience.
Keep in mind what we’ve said before and will probably say again: One day is never a trend and you should never sell out of fear or because others are selling. If you’ve met certain goals you had for your portfolio this year, perhaps, there’s nothing wrong with some portfolio rebalancing. That’s especially true if the stock market’s gains so far this year have gotten your holdings out of whack, with more exposure to stocks than you’d planned.
But always have a reason before buying or selling and take time to consider. It isn’t a bad thing to wait a day or two and see if you still want to buy or sell before making a move. The way this market is going, it might take all this week for things to play out, so maybe by then, investors could have a better sense of the landscape.
Remember, too, that despite this soft September, major indices aren’t far from all-time highs. The SPX is just 4% below its peak. This means going “all in” here to “buy the dip” might not make much sense, either.
TD Ameritrade® commentary for educational purposes only. Member SIPC.
Image by Pavel Karásek from Pixabay
© 2024 Benzinga.com. Benzinga does not provide investment advice. All rights reserved.
Date | ticker | name | Actual EPS | EPS Surprise | Actual Rev | Rev Surprise |
|---|
Trade confidently with insights and alerts from analyst ratings, free reports and breaking news that affects the stocks you care about.

