


Three days later, that blowout jobs report apparently hasn’t lost its new car smell.
That’s how the market’s acting early Monday after most of us were denied a chance to trade on the actual day of the March jobs report with markets closed Friday for the holiday. It was the first time in about a decade that a jobs report coincided with a market closure, so there’s a little sense of delayed reaction, so to speak.
Stock index futures rose Sunday night and into Monday, heading toward new all-time highs. This follows a rally in European stocks, but many Asian markets didn’t trade overnight due to holidays there.
Major indices were all up roughly the same amount heading into the open, so it doesn’t look like any one sector is getting favored. That said, Tesla Inc TSLA got a nice burst in overnight trading, up more than 7% after the electric car company’s Q1 deliveries exceeded analysts’ expectations. Cruise lines and car companies also moved higher, a possible sign that the “reopening” trade could get another boost from the jobs data.
On the negative side, GameStop Corp. GME fell 13% in pre-market trading after the company announced plans to sell more shares. Some investors may have expected them to issue more stock to take advantage of the high price, and in some ways you can’t blame them. But with them doing it, the shares came under pressure.
Looking Like (Almost) A Million
By now, you’ve probably had plenty of time to digest last Friday’s jobs numbers. As a reminder, March U.S. nonfarm payrolls surged 916,000, the largest gain since last August. Data for February was revised higher to show 468,000 jobs created instead of the previously reported 379,000. Economists polled by Reuters had forecast payrolls increasing by 647,000 jobs in March.
It’s a great number, but it’s never a good idea to get too hung up on any one data point. The important thing is that the employment trend is pointing in the right direction. We’re not where we were pre-March last year. We’re still down 5.5% from our peak, but we continue to make great progress. And this particular report is one of the best progress reports we’ve had.
Drilling down deeper, hiring rose in most industries, led by a gain of 280,000 in the category that includes restaurants and hotels. Employment also rose sharply in construction, manufacturing, and the government. The construction number was a blowout, but let’s not get too crazy yet thinking things are all the way back in that category. Remember that February’s construction jobs growth was disappointing because of bitter cold across much of the country.
Seeing so many jobs come back in the hospitality industry was a very happy development. It means restaurants and bars are back open, which is great to see. It helps spending, and it helps the economy. People have said that there’s a bifurcation between the economy and the stock market, but hopefully this helps the economy catch up.
Overall, it was good to see the numbers spread out a bit more than they had been in February, when the leisure and hospitality industries dominated gains and some other key sectors like construction lagged. It looks like growth is more balanced now, another sign, perhaps, of people getting more comfortable being out and about.
It’s unlikely we’ll see this kind of growth every month, partly because some of the March gains might have been spillover from data that went uncollected during the February snow storms in the South. Still, it wouldn’t be surprising to continue getting solid numbers. Economists surveyed by The Wall Street Journal project employers will add an average of 514,000 jobs each month over the next year, for a total of more than 6 million. That would mark the best 12-month stretch of job creation in decades but leave overall employment totals below where they stood before the pandemic.
Batting 4000
Before the employment report, Thursday saw the S&P 500 Index (SPX) post a new milestone above 4000. With the index rising more than 1%, it was a great way to start the new quarter. There’s apparently money out there looking to be put to work, and some of it is ending up in stocks.
On the other hand, more money came out of the bond market Friday after the jobs report, with the 10-year yield climbing back up to around 1.74% to finish the old week. Volatility, however, is taking a spring nap. The Cboe Volatility Index (VIX) fell to a new post-pandemic low of 17.33 by the end of the week, perhaps a sign that investors are less worried about choppiness ahead.
The 4000 mark wasn’t just significant from a psychological standpoint. It also could have technical power, because the close above that took the SPX out of what had been a long-term trading range between about 3725 and 3970 that had held for the past couple of months This doesn’t mean things can’t go back down, and in fact we often see major indices get choppy right after they hit a big round number.
The Nasdaq Composite (COMP) also made technical strides Thursday by taking out a resistance point just above 13,300. This sets up both the SPX and the COMP for a good Q2 start from a chart standpoint, and may have caused some short covering as bears threw in the towel, so to speak.
Despite the strong jobs data, 10-year Treasury yields start the week not much higher than they were Friday at around 1.73%. The number to potentially watch here is the 14-month high of 1.77% recorded recently. Any move above that might raise some eyebrows and perhaps pressure stocks. Volatility is slightly up this morning, but the VIX remains under 18. We’re getting back to a more normalized VIX, so let’s see if it holds. It makes sense to see VIX lower as the market makes new highs, and it’s hard to fight all this money coming into the system and people out there spending.
Big Hair And Leg Warmers Return…Sort Of
Here’s more from the “way back machine.” If you’re old enough to remember the deep recession of the early 1980s, you may also remember the 1983–84 period as the time when the U.S. economy recovered some of its missing mojo. One indication was a more muscular manufacturing sector as Detroit’s auto industry gained strength and the computer revolution picked up steam.
Last week’s March ISM manufacturing index brought some 1980s nostalgia, hitting its highest level (64.7) since December 1983. That was 37 years ago, but the economies now and then have some similarities. Mainly, both are emerging from the depths amid major government stimulus (Biden’s $1.9 trillion plan now and the Reagan defense build-up then). One difference now vs. then, of course, is the Fed’s zero interest rate policy. The Fed funds rate in December 1983 was 9.5%, and that was considered low, down from as high as 20% in 1981 (the SPX finished 1983 at 164.9, by the way).
One other difference from the Reagan era is manufacturing’s percentage of the economy, now less than 12%. Manufacturing just doesn’t pack the same wallop it used to, though it’s still important. That’s why it’s key to check today’s ISM non-manufacturing index, which measures the strength of the services economy.
Another concern about last week’s manufacturing report is the prices paid component, which fell slightly to 85.6 in March from 86 in February but stayed way above last November’s 65.4. This could get people nervous about inflation hitting producers again. The question is whether higher prices paid by manufacturers eventually trickle down to the consumer level. This Friday’s producer price index (PPI) for March could be worth a look.
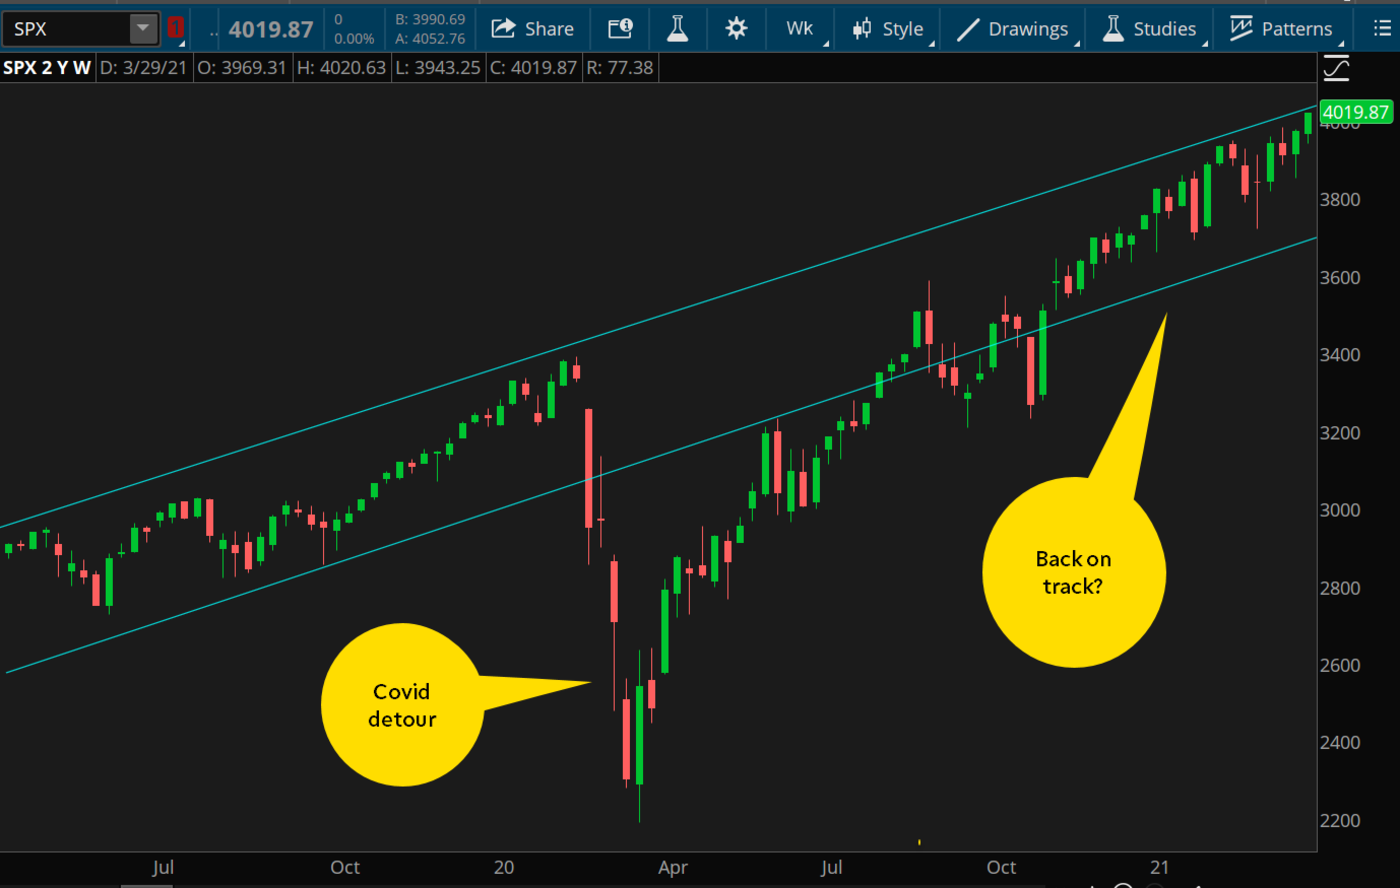
CHART OF THE DAY: ROAD TO 4000 TOOK A COVID DETOUR. This chart of the S&P 500 Index (SPX—candlestick) over the last two years shows how it reached 3000 in July 2019, climbed pretty steadily from there, and then took a huge plunge back in March 2020 when Covid hit. Since then, the path has been choppy but ultimately always up, until it breached the 4000 barrier last Thursday. Data Source: S&P Dow Jones Indices. Chart source: The thinkorswim® platform. For illustrative purposes only. Past performance does not guarantee future results.
Data Watch: Key numbers this week include this morning’s February factory orders report, and initial jobless claims this Thursday. Also look for Wednesday’s weekly U.S. crude oil stockpiles data as the crude market hovers around $60 a barrel. Last week’s announcement that OPEC plans to loosen its production curbs didn’t really weigh on crude as much as some might have expected. For now, $65 looks like a technical resistance point for U.S. prices. Crude flamed out at that level on an earlier rally in March.
The other thing people will be watching this week is the next steps with the infrastructure bill unveiled by the Biden administration before the holiday.
Zooming to an Inflection Point: Almost exactly seven months ago, Zoom Video Communications Inc ZM—one of the darlings of the stay-at-home trade—gapped higher on a big earnings surprise. Shares of ZM, which had already tripled since the start of the pandemic, advanced nearly 50% that day, from the low $300s to a high of $478. As technical traders know, that’s quite a gap. Then, after topping out around $580, shares have spent most of 2021 slowly filling that gap. As of this week, ZM shares have been chopping along those same $320s, right around where they were ahead of that Q2 earnings surprise.
What’s the message? While it’s rarely a good idea to put too much weight on a single data point, the ZM action (and recent inaction) looks to be playing out in quite a number of last year’s stay-at-home leaders such as Peloton Interactive Inc PTON, Shopify Inc SHOP, and Clorox Co CLX. None of these have cratered, but rather pulled back to the neutral zone—an inflection point, if you will. It’s like we remind readers frequently in this column—narratives and future possibilities can be a tasty appetizer, but at some point the proof needs to be in the earnings pudding.
Calm Before the Storm: Earnings season is still a couple weeks off, and this week features very little in the way of big, important companies reporting. Conagra Brands Inc CAG is one exception, with earnings expected to come out on Thursday. One thing a big food company like CAG can probably outline for analysts is the situation around input costs, especially with the price of many agricultural commodities on the rise. The company might also have insights into supply chain issues.
Other events to watch this week include Fed minutes Wednesday afternoon, a behind-the- scenes look at the March Fed meeting where we can get a sense of the Fed’s thoughts. There’s also an appearance at midday Thursday from Fed Chairman Jerome Powell at the International Monetary Fund Debate on the Global Economy as he participates in a discussion there. It seems unlikely he’d say anything market-moving, but it helps to stay on your toes whenever he speaks.
TD Ameritrade® commentary for educational purposes only. Member SIPC.
Photo by Saulo Mohana on Unsplash
© 2024 Benzinga.com. Benzinga does not provide investment advice. All rights reserved.
Date | ticker | name | Actual EPS | EPS Surprise | Actual Rev | Rev Surprise |
|---|
Trade confidently with insights and alerts from analyst ratings, free reports and breaking news that affects the stocks you care about.

