


It’s been a tough week for some of the world’s largest stocks.
Apple Inc AAPL and Tesla Inc TSLA keep losing ground (see more below), and now Walmart Inc WMT joins them as investors register disappointment with the company’s earnings and outlook. Shares fell 5% in pre-market trading after WMT missed Wall Street’s earnings per share projection and forecast tepid fiscal 2022 growth.
There was a lot to like about WMT’s quarter, including sales that surpassed expectations and rose 7.3% from a year ago to top $152 billion. Analysts had expected around $148 billion. U.S. same-store sales did even better, and U.S. e-commerce sales rolled up 69% gains.
However, the company’s $1.39 a share in earnings came up 12 cents short of the Wall Street average $1.51 estimate, hurt by WMT’s decision to repay property tax relief in the U.K. that cost it 7 cents a share on the bottom line.
WMT’s investment in supply chain and automation will probably be under a microscope the rest of year to see if investment panned out to continued growth. Digital advertising, health care, and web marketplaces are higher margin businesses than WMT’s core business.
They will be spending more on investment, and that will go toward trying to help the digital side of their business. Consider listening on the conference call to monitor for details on how profitable the e-commerce business has been because it actually doesn’t make money yet.
A big piece of the dip in WMT shares this morning was its outlook. WMT sees FY 2022 sales rising in the low single digits, with operating income and earnings flat to up slightly. WMT shares are up nearly 24% over the last year, ahead of the S&P 500 Index (SPX). This morning, at least, it looks like investors are dialing some of that back as they contemplate what looks like a pretty sluggish earnings picture ahead.
One other interesting note before we leave the WMT discussion: The company said it plans to raise its U.S. associate wages to an average of above $15 an hour. This could influence the debate around the minimum wage in Washington, where some in Congress want to raise the national minimum to $15 as part of the fiscal stimulus bill. We’ll see if those who want to raise it start to cite WMT’s move in their talking points.
Washington View: GameStop Hearing Up Next
After WMT, attention today could veer toward Capitol Hill, where a hearing on the GameStop Corp. GME stock controversy from last month will feature testimony from company leaders and investors involved in January’s stock market volatility. This is likely to be watched by the entire industry, from businesses to individual investors, and media reports say participants likely will face grilling from both sides of the aisle.
Other things on the calendar include import and export prices, which could be interesting, and this morning’s weekly initial jobless claims number. If people were hoping for some solace there after the disappointing WMT news, they didn’t find any. New claims rose to 861,000 in the latest week. That was way above the Wall Street consensus for 775,000, and up from an upwardly revised 848,000 the prior week.
Stock index futures—already under pressure from WMT—extended losses after the jobless claims data. Speaking of which, when you look at next week’s initial claims, they may appear lower than expected because it’s doubtful many people were able to file in Texas with the weather there this week. So a positive reading next Thursday might not tell the whole story.
Looking back at yesterday, the market basically pulled a pretty big head fake, recovering from early losses. It shows that it doesn’t make sense to panic when you see the market pull back, and instead you might chalk up sudden moves to the continued choppy pattern we’ve been witnessing.
Part of this week’s choppiness reflects that there’s a lot of economic data and earnings to digest, and Wednesday was particularly heavy with retail sales, producer prices, and Fed minutes. There’s also continued progress on the stimulus package, which is helping raise yields in the bond market.
Another thing to keep an eye on is the power outage situation in Texas. If it’s a short-term thing, the effect probably will be minimal. But if it continues, there could be a lasting impact on businesses, like you often see with hurricanes. Sometimes these types of weather events can hurt retail sales and even take a bite out of quarterly gross domestic product, though it’s too early to say if that’s going to happen.
Yield Surge Clips Tech Market
The Info Tech sector posted the worst results of all S&P 500 sectors yesterday, plagued in part by rising Treasury yields. Strong readings on January retail sales and the producer price index released early Wednesday gave the yield rally another lift, and higher rates are often considered a weight on Tech and other growth stocks. Remember back in late 2018 how the Tech market took a pounding after yields reached multi-year highs.
We’re nowhere near those levels now, which topped 3% for the 10-year Treasury yield back then. The current yield near 1.29%—down a few ticks this morning after the weak claims data—would have been an all-time low before last year, but it’s the momentum of its climb that may be causing worries for growth stock investors. It’s gone up around 40 basis points since the start of this year, a pace you don’t often see in this particular market.
One way to look at that could be that there’s never been a time quite like this, with the economy emerging from a self-induced (well, pandemic-induced) recession. It wasn’t a normal recession where demand began to flag or the financial markets got out of whack. Instead, we brought it on ourselves by shutting down the world economy. That, followed by central banks around the world immediately dropping rates to zero and scooping up bonds to push yields down, caused the record low interest rates.
Now if the pandemic truly is starting to retreat, it’s hard to find natural reasons for rates to be this low (aside from the fact that unemployment remains a major problem in the wake of the recession and may not be able to claw back as quickly as the overall economy). On the other hand, the Fed has said it has no plans to stop its $120 billion a month bond purchase program anytime soon, and forecasts the next rate rise not in terms of months, but years. This could ultimately put a brake on the yield rally, but we’ll have to wait and see.
Gold Keeps Struggling Despite Inflation Concerns
Let’s go from stocks that trade for pennies to a commodity that commands over $1,700 for just an ounce.
We’ve talked about the “risk-on” mood playing a bigger role lately, something you can see in the relatively weak dollar (which continues to scratch along near three-year lows), and falling bond values. Another possible sign of this could be what’s going on in the gold market. Gold has fallen four days in a row, and on Wednesday it carved a “death cross” on the charts (see chart below). That’s where the 50-day moving average falls below the 200-day moving average, and analysts say it can often point to more weakness ahead.
It’s a little bit odd to see gold taking a dive right even while the U.S. Congress looks like it’s getting closer to passing a huge stimulus bill that some analysts worry could drive up inflation. You’d think that with inflation becoming more of a concern (also possibly evident in the recent rise of Treasury yields), gold might be getting a bit more of an embrace from investors. Some analysts think that’s not out of the question. That would be good news for people holding shares of mining companies like Barrick Gold Corp GOLD and Newmont Corporation NEM, which have been in a slump lately.
Still, it’s been a rough few months for gold lovers who saw the precious metal rise above $2,000 an ounce last year for the first time. Gold recently traded at $1,772, down nearly $300 from last year’s highs.
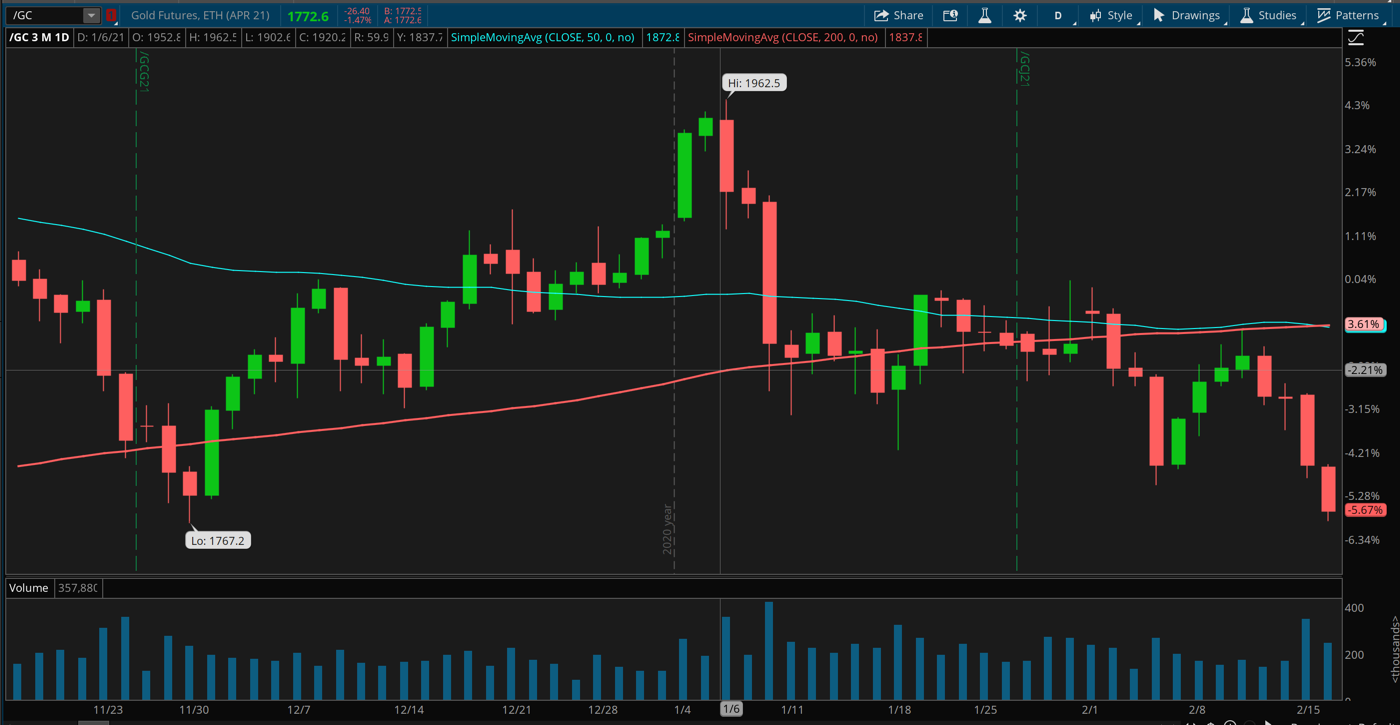
CHART OF THE DAY: GOLD’S “DEATH CROSS.” Gold (/GC—candlestick) has been falling pretty steadily from its recent highs, and has now painted a “death cross” on the charts. That’s when the 50-day moving average (blue line) falls below the 200-day moving average (red line). It’s usually considered technically bearish. Data source: CME Group. Chart source: The thinkorswim® platform from TD Ameritrade. For illustrative purposes only. Past performance does not guarantee future results.
Oh Where Oh Where? The market often resembled a game of follow-the-leader the last year or two, but two of its leaders appear to be missing in action. Apple Inc AAPL and Tesla Inc TSLA, which both split their stocks last summer and generated loads of enthusiasm among investors, are spinning their wheels so far this month. AAPL, which rose 10% in December and was flat in January, is down about 1.5% for February. TSLA rose 24% in December and 12% in January but is down 2.5% in February and back below $800 a share. Plenty of people will likely pin this on overbought conditions and profit taking, and they might have a point. It’s almost certainly not a reaction to earnings from either company, both of which drew accolades for their recent results.
One negative factor could be investor money moving in other directions. First of all, the reopening economy apparently is helping shares of Energy and Financial companies, along with smaller stocks that tend to do best when the U.S. economy improves. The Russell 2000 (RUT) small-cap index has been an early leader this year. Also, alternative investments like bitcoin have been a magnet for many investors, while rising bond yields may be drawing some people toward fixed income. Then things got tougher for AAPL on Wednesday with news that Berkshire Hathaway Inc.’s BRK Warren Buffett was selling some shares (though it remains a huge holder of AAPL). Whatever the reason, seeing AAPL and TSLA shares losing a little zip isn’t necessarily good for the broader market, which often moves higher on their lead. Instead, their recent lack of leadership may be zapping investor enthusiasm beyond their immediate orbit, while their huge market-caps have an oversized impact on the path of the Nasdaq (COMP).
“Oracle of Omaha” Strikes Again: Since we brought up Buffet (above), it’s worth noting that BRK’s stock purchases announced Wednesday veered toward a couple of sectors that until recently hadn’t received much love from investors: Energy and telecom. Verizon Communications Inc. VZN shares jumped 5% on news of BRK’s move, while Chevron (CVX) climbed 3%. Energy (which got dramatically smacked down by Covid in 2020) has been on a roll lately as reopening optimism picks up, so it’s not too surprising to see BRK taking a position in CVX. But VZN and its competitors T-Mobile Us Inc TMUS and AT&T Inc. T haven’t exactly been lighting up Wall Street with their performance lately. Maybe Buffett—widely known as a “value” investor—sees an opportunity in this run-down part of the market. A bit of a head-scratcher was BRK’s decision to sell some bank shares, another value sector that’s been gaining ground recently.
Should investors follow Buffett’s lead? Well, maybe they were ahead of him. The “value” segments of the broader market have been gaining vs. “growth” stocks lately, a trend we also saw for a couple of months last fall. Generally, however, Buffett’s been right more often than he’s been wrong over the years. Which is why they call him “the Oracle of Omaha,” of course.
On Short Squeezes and Hedgers: We saw what happened with GameStop Corp. GME and AMC Entertainment Holdings Inc AMC—two short-lived short squeezes that actually inflicted some real fear and pain among some hedge funds and other short sellers—who learned first-hand how far a market can detach from fundamentals during a squeeze. But another apparent target—a handful of silver-backed ETFs—was met with a fresh wave of selling almost immediately after piling in. Why the difference? The silver market is a commodities market, and much of the so-called “short interest” may be the very funds issuing these silver-backed ETFs, according to Goldman Sachs Group Inc GS.
In other words, the shorts are what commodities traders call a “commercial hedge.” So no matter how high or low silver goes, the funds holding them have either minimized exposure or no exposure at all (if it’s a 100% hedge). Plus, with the silver-backed ETF market worth only 900 million ounces in a larger 25 billion-ounce physical market, the funds are no more than a rounding error compared to the vast silver market. The lessons? Do your homework before you jump into any trade, even a follow-the-herd momentum trade. There may be no real safety in numbers. And not all short interest is subject to the same squeeze dynamics as a low-liquidity stock.
TD Ameritrade® commentary for educational purposes only. Member SIPC.
Photo by Fabio Bracht on Unsplash
© 2024 Benzinga.com. Benzinga does not provide investment advice. All rights reserved.
Date | ticker | name | Actual EPS | EPS Surprise | Actual Rev | Rev Surprise |
|---|
Trade confidently with insights and alerts from analyst ratings, free reports and breaking news that affects the stocks you care about.

