


Let’s start with what we know: We’re in the midst of a brutal selloff that rivals historic ones like 2008 and 1987. The major indices are down 29% or more in just a month, and the S&P 500 Index (SPX) took out its Christmas Eve 2018 low intraday before clawing back a bit at the end.
Crude fell 24% today alone, hitting levels not seen since early 2002. Every major index lost 5% or more, and the small-cap Russell 2000 (RUT) dropped more than 11%. All of SPX gains since the end of 2018 are gone, just like that.
When you have a day like today where everything sells off with almost no exception across various asset classes (with the exception of investors flying toward the U.S. dollar), it probably signals that people just want their cash and a chance to re-assess. The theme seems to be “risk-off” just about everywhere. A late spurt of what looked like short-covering in the final minutes Wednesday probably shouldn’t be looked at with much confidence, because recent other bursts like this haven’t had much meaning the next day.
This is a little bit unlike anything else we’ve had before because of the unknown length and the unknown implications of the crisis. There’s no reason to expect any end to these crazy swings in the meantime.
Until now, with the possible exception of the days just after Sept. 11, there’s never been a period in modern history where people across the world purposely stayed home, stopped traveling, and put off most essential purchases. A typical recession can slow economic activity, but not usually to this extent. That helps explain why the selloff might be different than some in the past. Climbing out of this ditch is going to be an uphill battle, and the hill seems to keep getting steeper.
One thing to note: The media tend to focus on the Dow Jones Industrial Average ($DJI). Remember, that famous index has only 30 stocks and arguably doesn’t reflect things as well as the broader SPX. The $DJI ended up doing much worse than the SPX today, in part because of huge damage done to a couple of stocks. That’s not to say the SPX is necessarily in good shape, because it’s not. However, it might provide a better picture of the true extent of today’s selling.
It’s probably going to be seen as technically positive that the SPX fell below its Christmas Eve 2018 low Wednesday and then recovered to close above it. Lately, however, technical stuff is getting washed away in waves of selling just about every day, perhaps making it less useful as a guidepost.
Few Escape Deep Red; Oil Leads The Charge
Today’s selling hit even “defensive” areas like bonds and gold. The only horseman of risk going up Wednesday was volatility, as the Cboe Volatility Index (VIX) stayed above 80 and near all-time highs. The dollar was another exception to the general selling, with the dollar index finishing above 100 for the first time since 2017. This gravitation toward the dollar might reflect what’s sometimes called a “flight to safety,” though no investment can be considered “safe.”
This was the eighth-straight day of 4% moves for the SPX, the longest stretch ever. The old longest was six in November 1929. Not a year that it’s fun to be compared to. Today was the third “washout” kind of trading day in the last five (the other two featured rallies that got sold almost as soon as they happened).
That said, some sectors are performing less badly than others. Utilities and Staples were down only about 6% today. Some staples companies like Walmart Inc WMT and Walgreens Boots Alliance WBA seemed to be holding on, while other big stocks like Cisco Systems, Inc. CSCO and Netflix Inc NFLX also did OK, comparatively. It’s interesting to see that after a very poor stock performance in 2019, WBA is no longer the “dog of the Dow,” a term typically used to describe the worst-performing $DJI stock. Today, those dubious honors would go to beleaguered aerospace giant Boeing BA and oil services mainstay Chevron Corporation CVX.
Speaking of oil services, there’s no dismissing the massive, massive pain inflicted on stocks today by the oil market. Energy sector shares plunged 13%, and the sector has lost more than half its value since the start of the year. With so many Energy companies producing oil and natural gas domestically, the crisis in the oil patch is no longer just a potential problem for the Middle East, but also for the U.S. economy.
Also, oil is often seen as a barometer for the global economy. It’s down more than 50% since the start of the year partly due to Russia and Saudi Arabia squabbling over production, but also because demand is seen drying up amid the social distancing caused by the virus. When less energy is being used, it often implies an economy that’s also slowing. This time, the slowdown hit hard and no one knows for how long.
Another danger is the credit markets. Bond prices continue falling, driving up yields. This could deepen the pain for highly-leveraged companies and any small businesses relying on loans. And for multinationals and companies that rely on exports, the surging dollar could be another headwind. The greenback surged above 100 for the first time in nearly three years.
Surveying the carnage across all sectors today, it’s hard to get a sense of when or if people will finally come in to buy in any sustained way. Every rally has been hammered down the very next day. That would probably keep potential buyers more cautious. Sentiment is poor in the market right now, as you might expect, and the VIX is a good indicator of that. If VIX does start to move steadily lower at some point, which few are predicting now, that might be a harbinger of optimism.
Thinking Of Stepping In? Consider Keeping It Small
At this point, it’s a very dangerous market to venture into and arguably should only be traded in small increments, and possibly by scaling in to use dollar-cost averaging if things move lower. It very well might get worse before it gets better. Try and keep your composure, even if it’s hard to do.
Anyone who does take a new position should probably consider widening their levels with this high volatility. Swings are likely to stay dramatic for a while. Widening levels means expecting things to move higher or lower more sharply and quickly than normal, so be aware of what you’re comfortable potentially losing and the duration you’re thinking about. If it’s for the long-term, be ready to suffer a little now and keep your eye on the ultimate destination.
As we’ve said before, there’s no door prize for being first to this party. It’s not time to be a hero, and the historic highs in the VIX make that seem very clear. If you do participate, you may want to consider the options market. There are options strategies designed for times of high volatility, but remember that options aren’t appropriate for everyone. If you do choose to use an options strategy in a high-VIX environment, it’s important that it be risk defined.
Now might be a good time to consider your investing time horizon and risk tolerance. That’s why you might want to think iteratively—meaning small pieces of your portfolio. Decisions made out of fear or greed typically don’t turn out so well.
If you feel you have to sell shares in these times, consider keeping it to small amounts. Having some cash on the sidelines isn’t necessarily a bad idea. However, if you can take a long-term view, this could be one of those times where it might help to keep things in perspective.
While past isn’t precedent, the market has been through many downturns in the past, and typically rebounds. Still, the average decline in past bear markets associated with recessions (which many economists now expect to happen) has been worse than 40%. We still aren’t down that much—yet.
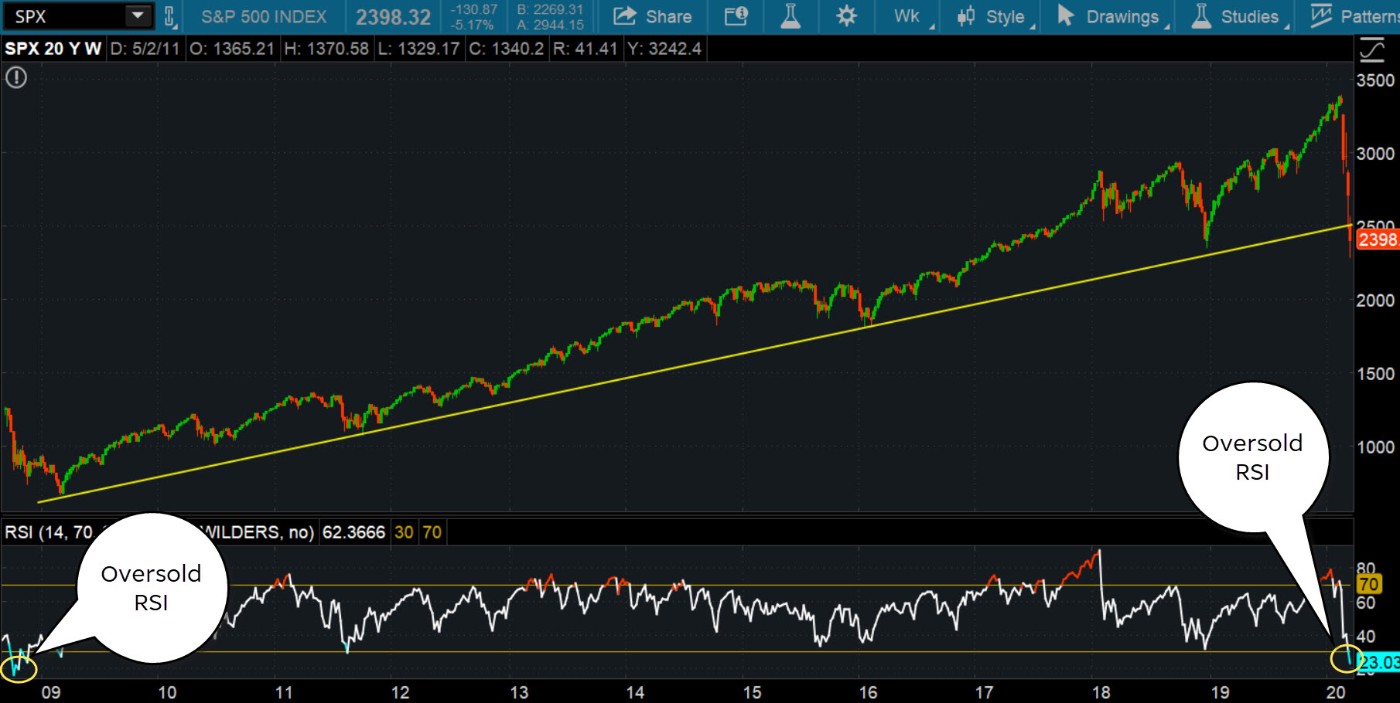
CHART OF THE DAY: DEEP IN OVERSOLD TERRITORY. In addition to breaking below its upward sloping trendline, the S&P 500 Index (SPX–candlestick) has entered a deep oversold territory in the weekly time frame, as indicated by the relative strength index (RSI–subchart). We haven’t seen such oversold levels in the RSI since 2008. Data source: S&P Dow Jones Indices. Chart source: The thinkorswim® platform from TD Ameritrade. For illustrative purposes only. Past performance does not guarantee future results.
Information from TDA is not intended to be investment advice or construed as a recommendation or endorsement of any particular investment or investment strategy, and is for illustrative purposes only. Be sure to understand all risks involved with each strategy.
Image by Lorenzo Cafaro from Pixabay
© 2024 Benzinga.com. Benzinga does not provide investment advice. All rights reserved.
Date | ticker | name | Actual EPS | EPS Surprise | Actual Rev | Rev Surprise |
|---|
Trade confidently with insights and alerts from analyst ratings, free reports and breaking news that affects the stocks you care about.

