


Today wasn’t the worst day in stock market history, but we only have some infamous years like 1987 and 1929 to thank for that. Daily losses never got this steep even during the financial crisis of 2008.
When you’ve been around long enough in the stock market, there are days that end up being a washout. That’s what Thursday might have been. It’s a day when people sometimes sell without much rhyme or reason, and you can really feel the pressure.
Even if today ends up being the “washout” of this downturn, it doesn’t mean more selling can’t happen. We could easily get another day like this.
What brought that home for a lot of people might have been how things went after the Fed announced this morning that it plans a $1.5 trillion cash injection. The S&P 500 Index (SPX) began moving up as the news hit, and got all the way up to 2640. It felt like we might have some momentum and move higher, but then the rally completely failed and the market broke down to new lows as the SPX closed under 2500 for the first time in more than a year. It peaked at nearly 3400 less than a month ago.
All Major Indices Now Officially In Bear Territory
The SPX has now joined the Dow Jones Industrial Average ($DJI) and Nasdaq (COMP) in bear territory, with all three down more than 20% from their recent highs. That feels like years ago, but it was only last month. The $DJI closed almost exactly 10% lower today, while the SPX fell 9.5% and the COMP fell 9.4%. Small-caps fell double digits and the Cboe Volatility Index (VIX) rose above 76 to new 11-year highs. It was the sixth-worst day in history for the $DJI.
It’s been a very rough ride for investors, and anyone trading these markets should consider keeping trade sizes low amid all this volatility. Also, it might make sense not to make any trades based on anything too far off on the horizon. Instead, you might want to consider limiting yourself to trades where you might be planning to move out again in a couple days or months at most. There’s just too much we still don’t know about the ultimate implications of this strange environment.
For long-term investors, there’s not much comfort. It’s hard to watch a year’s worth of gains go out the door. Long-term investors might also want to keep in mind that even if there’s a recession, the U.S. economy was in decent shape going into this, and there’s never been a recession that didn’t end. They’re a natural part of the economic cycle. Of course, knowing this doesn’t necessarily make it easier to go through one. Also, remember that past performance doesn’t necessarily give us any guarantees about the future.
With Thursday’s losses, markets are now further below their 200-day moving averages than they were above them a few weeks ago. For the SPX, the 200-day is above 3000. A more important technical point to watch, the way things keep heading lower, is the area around 2350 where the SPX bottomed in late December 2018 after a dizzying three-month plunge.
What’s The End Game? Confusion Means More Weakness Possible
Is this dramatic selling pressure justified? No one can really say, because we don’t know the final impact of the virus on economic activity.
Back in December 2018, things seemed scary, but the situation was fundamentally clearer. With the Fed raising interest rates to 10-year highs that month, it seemed obvious that a few rate cuts could probably address the market’s concerns. The trade war was another aspect at that time, but most people likely believed that if the market pain grew too big, the leaders of China and the U.S. would probably find a way to compromise and soothe investors.
Even after the Sept. 11 attacks, which up till now were arguably a similar disruptive event for the markets, there was some sort of end game. The U.S. declared war on terrorism and people bought stocks partly out of patriotism. It soon became evident that a follow-up event was unlikely.
This time, bigger forces are at work and solutions aren’t right at hand. No one knows how long the virus will last or what can be done to contain it. When there’s no obvious end game and no sign of when things might get to the point where you can declare victory, people get nervous and they sell things.
Fiscal policy could help ailing industries, and seems likely to come in at some point. Airlines, resorts, casinos, and the oil sectors are all suffering badly. Some in the media suggest President Trump might want to reconsider the infrastructure program he talked about a few years ago. That would have the potential to inject lots of money into a bunch of major industries, but federal funding does have a way of taking time to come through (think back to the 2009 stimulus, for instance).
If stimulus does take place, one thing it might do is push long-term bond prices lower, causing longer-term yields to rise. There’s already some evidence of this, with 10-year and 30-year yields up today. The shorter-end of the yield curve—where the Fed took action today—is getting beaten down. The 10-year yield of 0.85% now has almost a 40-basis point premium over the two-year yield. Remember that at times last year, these two yields inverted, so it’s really quite the 180.
As Earnings Estimates Fall, Concern Grows
Analysts, in the meantime are taking down their earnings estimates. Earnings drive the markets, and the question is when people will coalesce around some estimates that seem to fit the current state of the economy.
At that point, price discovery could get easier, but it might not be until next month that investors have a better sense. That’s because earnings season starts in mid-April and companies will begin to deliver their updated guidance. Some big firms like Apple Inc AAPL and Microsoft Corporation MSFT have already warned of hits from the virus. It’s likely there’s a lot more of that ahead for other companies across all sectors.
There’s not much else in the way of clarity, but it wouldn’t be surprising at this juncture if people continue to gravitate around the big dividend-paying stocks with tons of cash. Stocks like those might be appealing, while companies relying on borrowed credit are likely to make investors even more nervous.
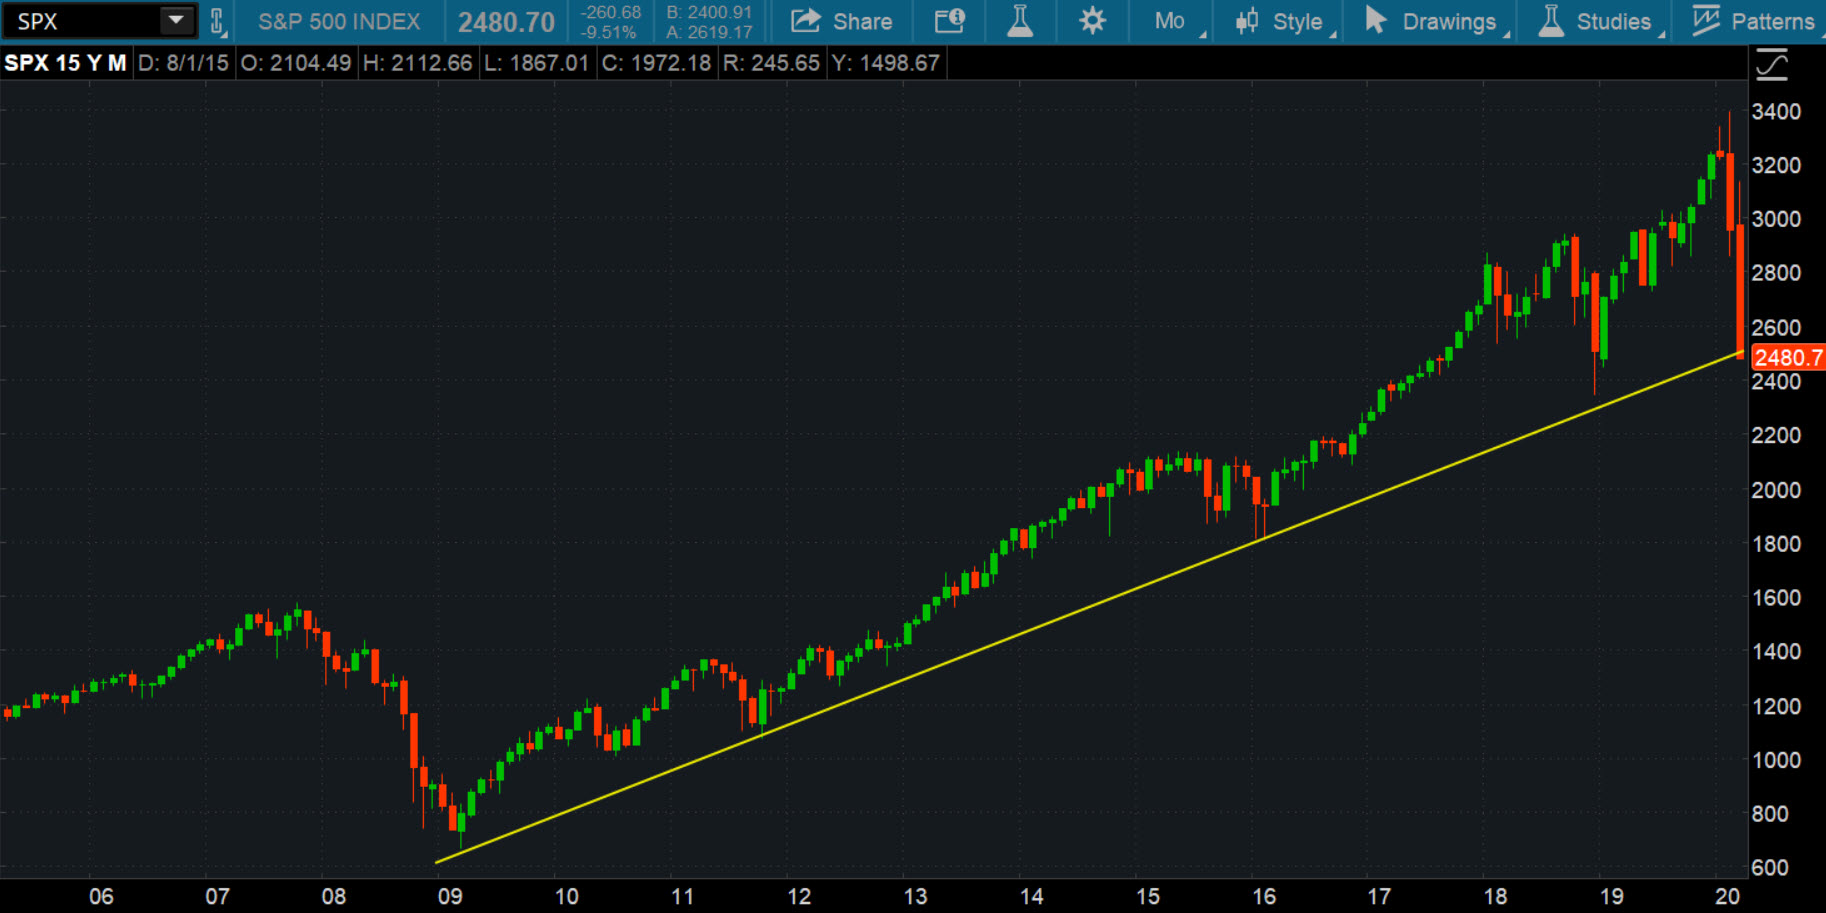
CHART OF THE DAY: A LONGER-TERM VIEW. Looking at the monthly chart of the S&P 500 Index (SPX – candlestick) going back to 2009, the index has been moving along an upward sloping trendline that acted as a support level in 2009, 2011, 2016, and came pretty close to it in 2018. With SPX closing at its low, it looks like SPX closed below this long-term trendline. Does this mean more washout as we head into tomorrow? Data source: S&P Dow Jones Indices. Chart source: The thinkorswim® platform from TD Ameritrade. For illustrative purposes only. Past performance does not guarantee future results.
Information from TDA is not intended to be investment advice or construed as a recommendation or endorsement of any particular investment or investment strategy, and is for illustrative purposes only. Be sure to understand all risks involved with each strategy.
Image Sourced from Pixabay
© 2024 Benzinga.com. Benzinga does not provide investment advice. All rights reserved.
Date | ticker | name | Actual EPS | EPS Surprise | Actual Rev | Rev Surprise |
|---|
Trade confidently with insights and alerts from analyst ratings, free reports and breaking news that affects the stocks you care about.

