


There’s an old saying that the market climbs the stairs and jumps out of the window. Clearly today was a “window” day.
With last year’s trade war, people had dates they could watch with pre-set deadlines that would show progress or lack of progress. There’s no “date” with coronavirus because no one knows how long it will be a factor, and that’s tough for people to get their arms around.
Today was the worst day in more than a decade for the stock market, and bond yields again hit historic lows as pressure from the crude market became a new and unwelcome visitor when investors were already having a tough time.
Finding positives on a day when major indices fell more than 7% and crude oil plunged to four-year lows as Saudi Arabia and Russia locked horns is like searching for a contact lens on a football field. It’s somewhat constructive to see 10-year yields end the day above 0.5%, which normally would be considered amazingly low but definitely looked better than the morning trough of around 0.31%.
Gold topped $1,700 an ounce intraday but finished below that. Crude ended about $3 above its pre-opening bell four-year low of $28 a barrel. The Cboe Volatility Index (VIX) was recently in the mid-50’s after topping 60 earlier for the first time since the financial crisis. That’s about all from a positive perspective, and it’s slim pickings.
Also, things still aren’t quite in a bear market, for what it’s worth. The roughly 19% drop from all-time highs in February for the S&P 500 Index (SPX) is still a little ways off from an official bear market, which is a 20% fall. To get there, the SPX would have to approach 2700.
Putting Today In Context
If you don’t want to look at your portfolio right now, welcome to the club. Today’s drubbing wasn’t pleasant for anyone in the markets, and you may be feeling a bit down in the dumps, to say the least.
While it’s best not to get too emotional about your money, it’s understandable to feel that way now. If you’re worried about further risk, it’s not wrong to consider exiting a small portion of your stock investments if that helps you feel like you’ve responded to this rough stretch.
Having said that, it’s being “all in” or “all out” of markets that tends to really hurt people. Consider handling times like these the way the professionals do, by making smaller, more iterative moves, and not dumping stocks indiscriminately or selling everything and walking away. The idea is to try and keep calm, though admittedly it might feel like a challenge at times.
Also, your actions here should reflect your own position as an investor. If you’re in it for the long term, say, 10 years, ultimately this stomach-churning pile-on is probably going to look like a blip on the charts, as hard as that might be to believe. There’s never been a correction or bear market that hasn’t recovered.
While no one is saying this can’t be the first time things don’t come back, the laws of probability argue against it. That’s why long-term investors might want to consider staying the course and not looking too closely at their positions every hour or every day.
That said, make sure you’re comfortable with your asset allocations. If you didn’t pare some of your stock market exposure a few months ago when things were rolling up, you might be regretting it now. It’s not too late, however, to take a careful look and make sure you’re not still more exposed to stocks than you wanted to be.
For someone who trades the market regularly, this sharp downward turn and the high levels of volatility might feel different. Like a picnic or a birthday. It’s not likely that volatility can stay at these peaks forever, so traders are probably taking advantage while they can. Even if that describes you, don’t assume you know more than everyone else, because that’s when you can get slammed by the market. A humble approach can be better.
What Does History Show?
While no one expects things to get better right away and no one is denying the pain investors have already suffered, there are things to tell yourself that might help keep things in perspective. For instance, the market has experienced 26 days since World War II (before today) when major indices fell 5% or more. If you go out 30, 60, 90, or 180 days from those points, things typically got better. The average gain after six months was 18% combined for those 26 days.
This sell-off has also made some very fundamentally-sound companies have shares looking quite cheap. No rule says they can’t fall further, but the huge drops have in some cases thrown out babies with the bathwater.
If there are some stocks on your list that still look sturdy from a fundamental standpoint but seem like they’ve been hit harder than they deserve, that might be something to consider as a potential opportunity. This only applies to those who still have money on the side. If most of your investment dollars were already in the market, perhaps it’s better to just hunker down.
Any Sign Of A Bottom?
That brings us to some technical points. At its lows today, the SPX approached some interesting chart territory. The level to keep an eye on is 2730, which marks a 61.8% retracement from the high of mid-February back to the lows of December 2018 (see chart below).
It’s also an important chart point because it coincides with the three-year volume profile point of control level, price level where the E-mini S&P 500 Index Futures (/ES) has traded the most number of contracts over the last three years. With the SPX falling to near its lows for the day in the minutes before the closing bell, that could set up a test of 2730 early tomorrow. If it holds, maybe that’s a positive sign, though it should be noted that not many technical support levels have been able to withstand this barrage of selling since late February.
Below 2730, the next chart spot to consider watching is the 200-week moving average around 2640. The 200-week moving average held in the December 2018 downturn and back in 2011 during a similar dip. Moving averages aren’t a panacea, but they can sometimes represent long-term support if you’re a long-term investor wondering what, if anything, could slow this rush of selling.
From a rate perspective, Fed funds futures just keep dialing down the numbers. By late Monday, chances were around 70% of a 75-basis point rate cut this month, and 30% chances of a 100-basis point cut. The Fed already cut rates 50 basis points last week. Economists continue to wonder how much a Fed rate cut could help in what seems like a supply-driven downturn.
At this point, it wouldn’t be all that surprising to see the Fed come out with some sort of announcement or statement in the next 24 to 48 hours. Not a rate cut, necessarily. But perhaps something to calm fears.
Sector Watch
Speaking of fears, that’s probably the word to describe anyone who had investments in Energy or cruise line stocks at this point. Most of the major cruise companies saw shares fall 20% or more today. Royal Caribbean Cruises Ltd RCL was one of the worst hit, falling 24% after the State Department warned Americans to avoid cruise ships.
The Energy sector had the bottom drop out today in dramatic losses approaching 20%. Financials, slammed by a yield picture that keeps falling to historic lows, fell double digits. By late in the session, Health Care was the only sector not down 5% or more. Ten of the 11 S&P sectors are down 10% or more from their recent highs. Nasdaq (COMP) had its worst day in nearly 10 years.
Some of the former “darlings” like Apple Inc AAPL and Tesla Inc TSLA had rough days. AAPL took a blow on news that demand for iPhones in China fell dramatically last month. TSLA could struggle if crude prices stay this low, because it’s less likely someone would pay big money to buy an electric car when there’s cheap gas at the pump.
Major airline stocks are all down between 30% and 60% from their recent highs. Some microchip makers fell double digits today. The dollar index fell sharply to below 95 as rates weighed. The carnage spared few.
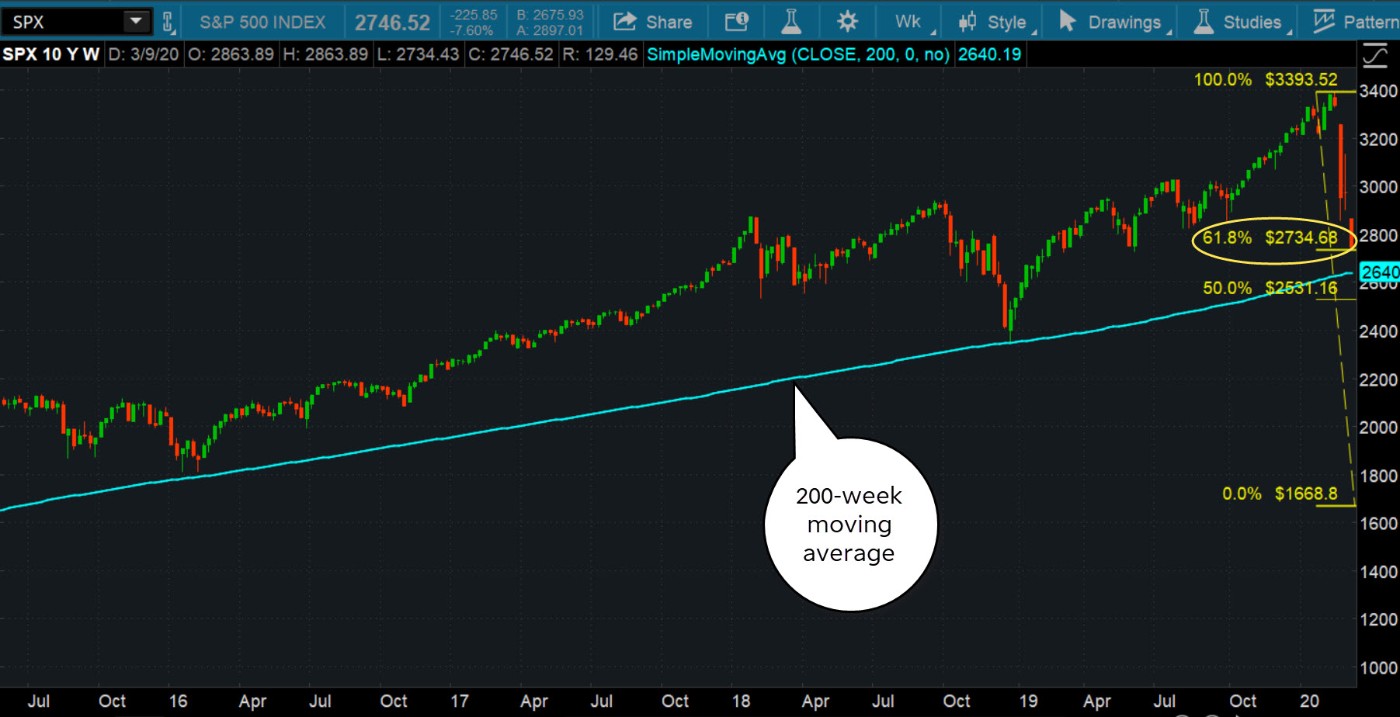
CHART OF THE DAY: S&P 500 INDEX (SPX) NEARS KEY RETRACEMENT LEVEL. A 61.8% retracement level from the February highs would have the SPX at around 2730. It closed just above that level. If SPX breaks below the 2730 level, the next area of support is the 200-week moving average at 2640. Data source: S&P Dow Jones Indices. Chart source: The thinkorswim® platform from TD Ameritrade. For illustrative purposes only. Past performance does not guarantee future results.
Information from TDA is not intended to be investment advice or construed as a recommendation or endorsement of any particular investment or investment strategy, and is for illustrative purposes only. Be sure to understand all risks involved with each strategy.
© 2024 Benzinga.com. Benzinga does not provide investment advice. All rights reserved.
Date | ticker | name | Actual EPS | EPS Surprise | Actual Rev | Rev Surprise |
|---|
Trade confidently with insights and alerts from analyst ratings, free reports and breaking news that affects the stocks you care about.

