


For once there’s something to talk about that’s not coronavirus. There’s no shortage of news items this morning, and stocks got a nice overnight tailwind.
First among equals was last night’s Democratic Super Tuesday primaries. While this column takes no position on politics or candidates, it’s fair to say that the election results provided a boost. A lot of participants view former Vice President Joe Biden’s strong showing as a healthier thing for the market if a Democrat ends up winning the White House because he’s a little more pro-business, so that’s helping.
The news headlines are focused on the political factor today, but that’s not all. Apple Inc’s AAPL factories in China reopening and a major AAPL supplier there telling The Wall Street Journal yesterday that production could return to normal levels by this month is a big deal.
It’s a combination of AAPL, Super Tuesday results, and perhaps some thoughts that we just overshot the mark yesterday in terms of negativity. People might be asking themselves, “Are things really that bad?” However, it wasn’t a huge surprise to see the market give up a little of the positive momentum as the open approached.
Nothing says these gains will last, so strap in. Things are still really volatile, with the Cboe Volatility Index (VIX) choppy overnight and still well above 30. Like last year with the trade war, we’re never more than a negative headline away from possible sharp losses—though this time the headlines are medical, not financial. That’s why anyone jumping in today should consider taking extra care, limiting trade sizes, and making sure not to invest any more than you can afford to possibly lose.
Participants this morning are also trying to square up the overnight stock market rally with the current position of the 10-year Treasury yield. It’s hovering right around 1% this morning, or the market equivalent of the “Mendoza line,” to use an obscure baseball term fans will understand that denotes a terrible batting average. Right now, just staying above 1% might look like a moral victory, but the fact is that’s still incredibly low.
On the data front today, investors soon get to see the ISM non-manufacturing index for February. This report, which measures business activity in the services sector, has been on a bit of a roll lately. The question is for how long? February’s data probably shows some, but not all, of the potential virus impact. Analysts expect a solid headline number of 54.8%, according to Briefing.com.
Earnings are kind of light today from a major company perspective, but people are getting geared up for Costco Wholesale Corporation COST tomorrow afternoon. The monthly payrolls report looms Friday (see more below). A private company’s payrolls report today looked strong, but doesn’t always match up with the official government numbers.
Odds And Ends
Now that the Fed has cut rates 50 basis points, investors see about a 50% chance that rates could go down another 25 basis points by the April meeting, futures prices suggest. It’s a little early to be thinking about that, but it’s possible some people were disappointed yesterday that the Fed didn’t cut all 75 at once.
Basically, the Fed’s move didn’t seem to satisfy a market hungry for more—including some people who apparently had hoped the Fed might announce a new round of “quantitative easing.”
As things get started today, psychological support at 3000 might be a factor for the S&P 500 Index (SPX), which finished just above that yesterday in kind of a moral victory after falling below it late in the session.
A drop back below 3000 could open the way to technical selling, and the way things have plunged so dramatically lately it wouldn’t be surprising to once again see last week’s lows below 2900 tested. However, volume yesterday was slower than last week, which might mean some of the most dramatic selling is behind us.
Above the market, look for possible resistance at the 200-day moving average near 3045 and above that in the zone of between 3170–3220. That could continue to represent a tough region for the SPX to plow through, because it marks the confluence on charts of a 61.8% retracement (an important technical signal), the 100-day moving average, and the descending 20-day moving average.
For direction outside the world of moving averages and retracements, consider watching AAPL and Microsoft Corporation MSFT. If you remember during the trade war, people kept a close eye on Caterpillar Inc CAT and Boeing Co BA because they were the big stocks considered most tied to the issue. In this case, AAPL and MSFT play that role, mainly because they’re the biggest behemoths and also have huge networks in Asia, hardest hit by the virus. Both led the parade higher on Monday and then lost significant ground Tuesday.
Another key factor this week is Friday’s monthly payrolls report. While the data mostly got compiled before the virus scare really started to spook everyone, it could be a reminder that the U.S. economy is still in pretty decent shape, as Fed Chair Jerome Powell said yesterday.
Analysts expect to see 170,000 new jobs created last month, according to Briefing.com consensus. That’s down from 225,000 in January, but remember the January report probably got some benefits pulled forward by warm weather that added more construction jobs than most people had projected. Average hourly earnings likely rose 0.3% in February, Briefing.com said.
Meanwhile, Treasury yields continue to point the way and may be the biggest single influence from here on. If the 10-year yield keeps burying itself around 1%, it’s hard to imagine any kind of long stock market rally. Interest rate pressure has been really hard on the Financial sector, and the old adage is it’s hard to rally without participation from the banks. Defensive sectors like Real Estate and Utilities probably can’t set the pace, and both are pretty high-priced at this point, anyway.
Rate Cut Impact Seen Delayed But Potentially Helpful
Thinking back to yesterday’s big news, there are some long-term positive possibilities if investors are willing to be patient.
For instance, lower U.S. interest rates might weigh on the dollar, potentially improving the earnings climate for multinational firms. It also makes U.S. rates more competitive with rates overseas, and could even provide a boost to Europe’s struggling economies if a little money stops flowing across the Atlantic to chase higher U.S. yields.
If rates do stay low, Q3 and Q4 earnings might start to reflect the benefits. Earnings drive the market, so this is potentially another point in stocks’ favor, longer term. On the other hand, the problem is that until the bond market gives up some ground and yields start to rebound, it’s hard to imagine a sustained recovery in stocks.
As one economist pointed out, lower stock prices can be almost like a tightening of the money supply by making it harder for companies to raise funds (which they do by offering investors equity through stock sales). Though the Fed always cites its two primary mandates of low inflation and full employment, it’s likely that the central bank also got alarmed at the quick drop in equities last week and wants the market to come back at least a bit so companies don’t feel even lighter in their pockets.
Something that also comes into play and might be mitigated a bit through rate cuts is the so-called “wealth effect.” When stocks tank like this, people sometimes feel poorer, and stop spending. Typically, lower rates tend to help stocks over the long run, whatever you want to think about yesterday. If the virus eventually starts to lose its grip, the markets might be in a better position to bounce back in a few months. That’s a big if, however, because neither the Fed nor anyone in the markets or out of the markets knows when the virus might ease.
As we noted yesterday afternoon the problem with a rate cut is that it’s a long-term bandage to a cut that’s bleeding and needs stitches now. With the virus, the “stitches” would be some sort of vaccine or medicine that slows the transmission or eases symptoms. As Fed Chairman Jerome Powell said in his press conference, “Ultimately, solutions to this problem will come from others.”
Rate cuts tend to take four-to-six months to work through the economy. That might mean if we find something that mitigates the virus—whether it’s warmer spring temperatures or some sort of inoculation—we could be set up for a rocking good summer.
Perspective Time
So, imagine you’re a typical retail investor investing for the long-term and trying to make sense of all this. It’s understandable if the last week and a half has you feeling dazed. You might be among the people who sold shares, and there’s nothing wrong with selling some of your stocks if it helps you sleep better at night. Some analysts believe stocks were over-valued before all this and that a sell-off might have been healthy.
Hopefully you didn’t sell out of fear or decide to stay completely away from the market. In the long run, the important thing is to stick to your plan and remember that these situations are normal and happen now and then. We got through one in late 2018, and before that in early 2018. The winter of 2015-2016 wasn’t fun, either.
It’s important to keep a sense of perspective and remember that you can’t let one or two days affect your long-term thinking. We were repricing stocks last week based on the virus, and now there’s another repricing going on reflecting lower interest rates. This could take a while.
In the past, these big volatile events don’t clear up overnight. It can take weeks for the market to find a good level, so expect a lot of back and forth.
In the meantime, the SPX is at levels where it was at in mid-November. That wasn’t all that long ago. Of course the SPX could drop further, and perhaps test last week’s lows. That often happens at times like these. Volatility is going to stay high for a while. We likely have more days like Monday and Tuesday ahead. Unless you truly think the U.S. economy is done growing, however, it doesn’t make a lot of sense to give up on the stock market.
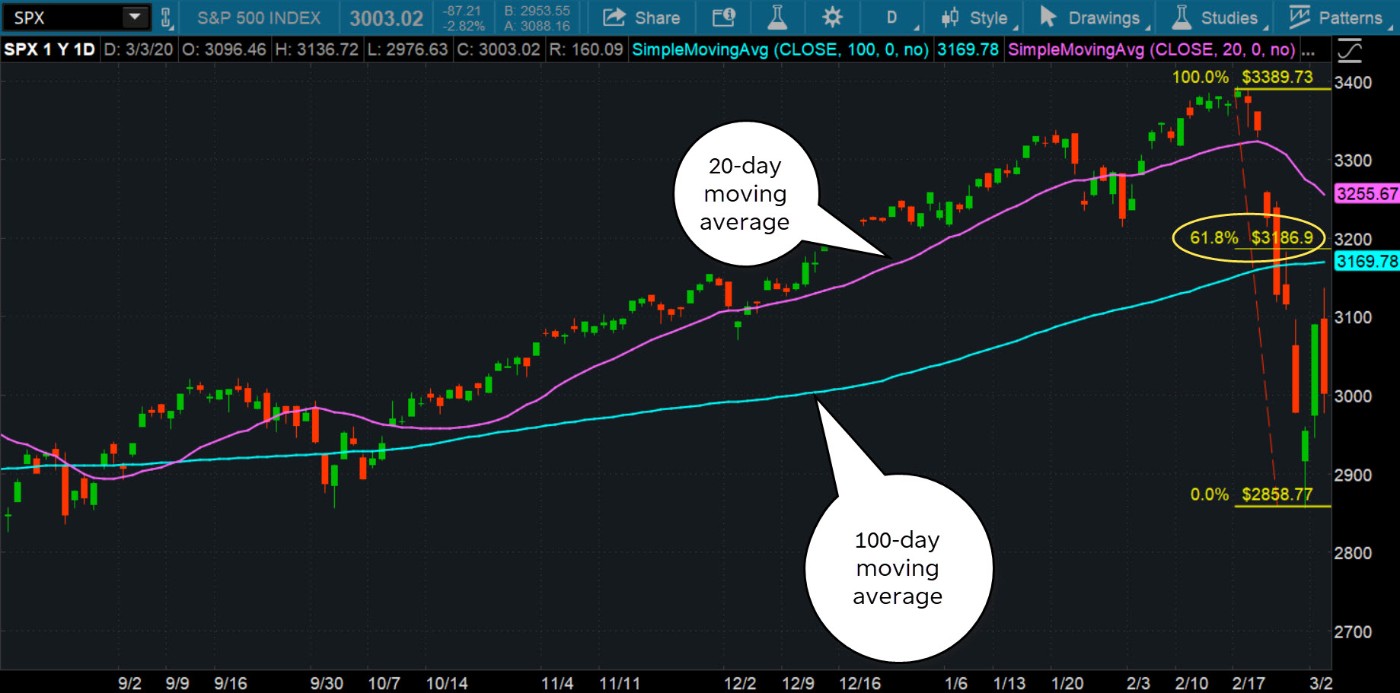
CHART OF THE DAY: CAN SPX FIND A GAP IN DEFENSIVE LINE? On the daily chart of the S&P 500 Index (SPX–candlestick), the 61.8% Fibonacci retracement level (yellow horizontal line), 100-day moving average (blue line), and 20-day moving average (purple line) come together between 3170 and 3220. This could prove to be a strong resistance level for SPX to break through, when it gets there. Data Source: S&P Dow Jones Indices. Chart source: The thinkorswim® platform from TD Ameritrade. For illustrative purposes only. Past performance does not guarantee future results.
Trivia Time: The SPX fell in January and February, the first time both those months have ended in the red since 2016—only the second time that’s happened in the years since the Great Recession of 2008–2009. A “double downer” to start things off doesn’t tend to be a good omen for the rest of the year, according to research firm CFRA. While past doesn’t necessarily tell you about the future, here’s a rundown of how the market performed in these kind of years:
Since World War II, whenever a down January was followed by a down February, the SPX posted a full-year decline 60% of the time, with an average loss of almost 5%, CFRA said. However, those years saw the SPX gain ground in March nearly two out of every three times, with price gains that month averaging 2.3%. Finally, the March returns following “double downer” openings were even more favorable during election years, rising in price 83% of the time and recording an average advance of 4.3%. Again, stuff like this is fun to look at, but shouldn’t be the basis for anyone’s investment strategy.
GDP Roundup: According to the Institute for Supply Management (ISM), the past relationship between PMI and the overall economy indicates that the February PMI reading released earlier this week corresponds to a 2.1% increase in real gross domestic product (GDP) growth on an annualized basis. At this point, a lot of investors would probably be happy with that (the Atlanta Fed GDP Now indicator, which tends to be backward looking, is at 2.7%).
However, Q1 isn’t over yet, and many Wall Street analysts see GDP coming in below 1.5%, especially with a month or two of the virus impact factored in. The PMI for March—due in a few more weeks—could conceivably head lower as cases spread around the U.S., something that hadn’t really started until toward the end of February.
IPO No-Go: In a sign of how money has gotten tighter, the situation we’re in has completely frozen the initial public offerings (IPO) market. No one seems to want to go public in this type of environment. IPOs are a way to raise money, but unless people feel more comfortable investing, they’re likely going to shy away from anything more aggressive like buying shares of a newly public company. It's part and parcel of a "proceed with caution" strategy, considering the amount of uncertainty floating around.Image by StartupStockPhotos from Pixabay
© 2024 Benzinga.com. Benzinga does not provide investment advice. All rights reserved.
Date | ticker | name | Actual EPS | EPS Surprise | Actual Rev | Rev Surprise |
|---|
Trade confidently with insights and alerts from analyst ratings, free reports and breaking news that affects the stocks you care about.

