


The week is off to a stomach-churning start as major indices got pounded Monday by growing coronavirus concerns. While China appears to be buttoning things up, it’s the spread of the illness to other countries that really appeared to get investors’ attention.
Virus cases surged in Iran, Italy, and South Korea. It’s the third of those countries that stood out from a market perspective, above and beyond the unfortunate human toll. South Korea is a huge maker and exporter of semiconductors, and that’s one reason why chip stocks got taken to the cleaners Monday.
A late rally attempt in stocks fizzled in the closing minutes and every S&P 500 sector ended in the red, with Energy and Information Technology hit hardest. Stocks finished near their lows, which isn’t a good sign technically, and the Dow Jones Industrial Average (INDEXDJX: .DJI) plunged more than 1,000 points on the day. Every major index fell more than 3% with the exception of the small-cap Russell 2000 RUT, making this the worst session for the broader market in two years.
It was an orderly sell-off without a lot of “panic selling,” but some of the “darlings of the Street” had a bad day, including Facebook Inc FB, Apple Inc AAPL, and Microsoft Corporation MSFT. Tomorrow turns into a wild card, as the “buy the dip” mentality really didn’t work today. On the other hand, much of the selling took place overnight before the session even began, and things didn’t get much worse after the open.
With coronavirus front and center, the defense remains fully on the field. While “defensive” assets like bonds, gold, and the Cboe Volatility Index (VXS) all came off their morning highs, there are still a lot of unknowns. When the market faces an unknown, investors tend to sell as a first reaction and figure out the winners as they go. That’s particularly true when we’re on the heels of a phenomenal rally.
VIX approached 26 at times on Monday and was near 25 at the close. At its peak, VIX reached its highest level since last September but remained well below the 36 it hit in December 2018.
This isn’t necessarily a market where you can draw a line in the sand. It’s likely we’ll see the drama play out over a few sessions, with the assumption being that earnings could be affected this quarter and maybe in the future. Earnings drive stocks, and now there might be a need to align stocks with these new earnings expectations. So it could be interesting to watch for any adjustments in Q1 earnings projections from analysts in the coming days.
Remember, it’s not as though people were expecting too much from Q1 earnings even before now. As of last week, S&P Global Market Intelligence pegged Q1 S&P 500 earnings growth at just 0.8%, down from the anticipated 1.6% in Q4. What really might get attention is if we see some of the chip companies start to follow up AAPL after AAPL warned about a revenue guidance miss last week.
For some, the sell-off might be a chance to re-assess. Anyone feeling really upset might be reminded of the old adage about how markets go up the stairs and fall out the window
Thoughts On A Rough Day
Let’s step back and take a little perspective. We’re in a rough patch, but investors who panic don’t tend to have good track records.
First, a lot of analysts were expecting a 5% to 10% correction at some point from the recent highs. If that’s what’s happening and it causes a little of the boundless optimism to retreat, it ultimately could be healthy for the market. Nothing goes straight up forever.
Also, looking at past virus situations, history shows each time one happened a vaccine was soon found and markets tended to be higher six months later. Though there’s no guarantee the future will be anything like the past, it’s usually a bad idea to doubt human ingenuity.
Another hopeful indication is that most of the major indices remain flat to a little higher for the year even with Monday factored in. Sectors still up include Utilities, Information Technology, and Real Estate and Communication Services.
One more positive takeaway Monday was seeing crude oil hold onto $50 a barrel and actually finish the day well above early lows. A drop below $50 would probably have indicated even more economic worries.
While bond yields fell to record lows for the U.S. 30-year, the 10-year Treasury yield wasn’t able to take out the 2016 all-time low of 1.34%. That’s probably not much comfort considering the 10-year yield is down roughly 60 basis points from its early-2020 highs and now trades at a steep inversion to the shorter-term three-month yield (often a negative economic sign and a potential drag on Financial stocks).
Contrarian Indication?
This is going to seem a bit more technical than usual, but we’ll try to explain it in layman’s terms because it could be useful to know. My friend and fellow TD Ameritrade Network contributor* Michael McKerr sent me some research that’s worth talking about.
One indicator that many people on the Street tend to monitor at times like these is the ratio of volume on stocks falling to stocks climbing on a given day. Selling pressure across the broader market was notably heavy Monday, with over 90% of the volume on the New York Stock Exchange (NYSE) on the downside. What that means is the volume of declining stocks outweighed the volume of advancing stocks by more than 9 to 1.
When you have a 90% down day, that typically goes hand-in-hand with steep losses in U.S. equity indices, but is sometimes seen as a contrarian indicator that can point toward a potential near-term capitulation moment (or in less technical terms, a possible near-term market bottom) ahead.
McKerr’s research shows that since 2015, there have been 27 of these so-called Major Distribution Days (MDD), with 90% down volume, not including today. In the five and 10 days after these days, the SPX often went on to make a lower low, but was higher by an average of 2.2% and 3.2%, respectively, from the MDD’s closing level.
That said, when the market experiences an MDD shortly after a fresh record high, it often doesn’t stop at just one. They can come in clusters because there’s a large amount of market length to be worked off. It’s also important to remember once again that the past doesn’t determine the future.
Not Everything Fell
Amid all the selling, there were actually a few winners Monday. Chief among them, at least looking at the biggest companies, was Clorox Co CLX, which investors scurried into perhaps on the hope of finding a “safe haven” investment, though no investment is truly safe. Verizon Communications Inc VZ was another behemoth getting some bids early, though it lost ground late in the session.
Other stocks getting a lift Monday as most of the market sank included a few that could see a direct positive impact from the virus. Among them were Newmont Corporation NEM, a gold mining company with shares up 3% as gold prices rode to seven-year highs amid virus fears. Then there was Gilead Sciences, Inc. GILD, a biotech firm whose medication is being tested on the virus in China. Shares rose more than 3%. Regeneron Pharmaceuticals Inc. REGN was another biotech on the climb, rising more than 4%.
While airline and other travel stocks got grounded, shares of Zoom Video Communications Inc ZM rose nearly 2% amid ideas that if people can’t travel to business meetings they might do them over video-conference.
For people wondering if and when technical support might become a factor, consider checking the moving averages. The S&P 500 (INDEXSP: .INX) took out its 50-day moving average on Monday, but it remains above the 100-day moving average of 3162. Below that is the 200-day moving average of 3043. If things go that far, it could get interesting because the 200-day represented solid support on several tests last year.
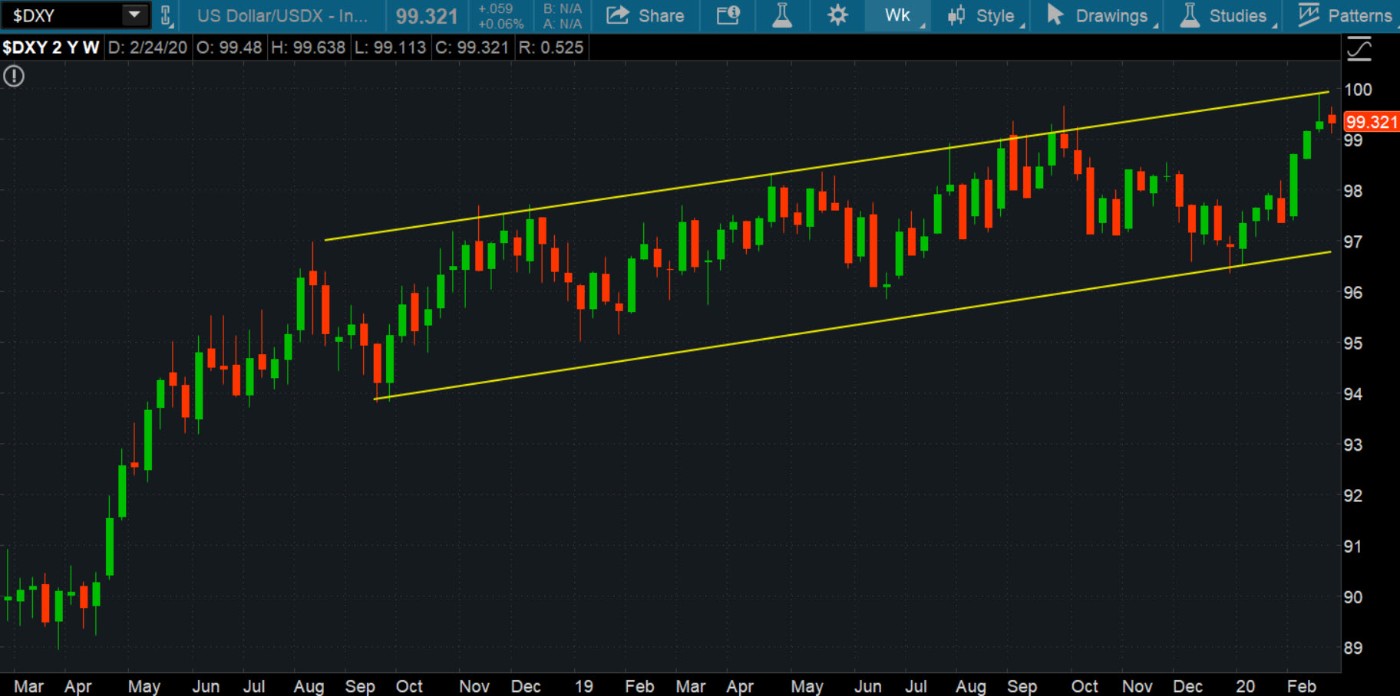
CHART OF THE DAY: DOLLAR PULLS BACK. The U.S. dollar index ($DXY-candlestick) has been moving relatively steadily within an upward channel (yellow lines) since the latter part of 2019. After the coronavirus outbreak, investors may have thought of the U.S. dollar as a relative safe haven, which took the dollar’s value toward the upper channel line. But when the virus spread to other countries, it could have caused a shift in sentiment as the U.S. dollar pulled back. If you look at it from a longer-term perspective, the dollar is still moving within its upward sloping channel and as long as it doesn’t go below the lower channel line, the trend is likely to still be in place. Data Source: ICE. Chart source: The thinkorswim® platform from TD Ameritrade. For illustrative purposes only. Past performance does not guarantee future results.
Information from TDA is not intended to be investment advice or construed as a recommendation or endorsement of any particular investment or investment strategy, and is for illustrative purposes only. Be sure to understand all risks involved with each strategy.
© 2024 Benzinga.com. Benzinga does not provide investment advice. All rights reserved.
Date | ticker | name | Actual EPS | EPS Surprise | Actual Rev | Rev Surprise |
|---|
Trade confidently with insights and alerts from analyst ratings, free reports and breaking news that affects the stocks you care about.

