


How do you measure a bull or bear market? Sure, there’s the classic definition of a bear market being 20% off a high. But if we’re talking price action, it might be this: In a bear market, rallies tend to fade, and in bull markets, a downside scare tends to reverse quickly, as bargain hunters swoop in. By that definition, yesterday’s bounce might indicate this bull still has some room to run.
The market started the week on the back foot as investors remained worried about the fallout from the killing last week of a top Iranian official in a U.S. drone strike in Iraq. But stocks ended up moving into positive territory during the session.
Other signs this morning that tensions have been easing—at least among investors—include that oil was pulling back and equity index futures were pointing to a flat-to-slightly-higher open after gains in Asian and European markets.
It’s possible that many investors don’t see the present situation in the Middle East as enough to derail the current decent economic situation in the United States and the help it’s been to the stock market. While the U.S.-Iran-Iraq situation does warrant monitoring, so far it hasn’t been enough to spark more than what looks like a bout of profit taking after recent gains.
Without new worrisome developments in the Middle East, it seems like the optimism about a trade deal getting signed soon and the backdrop of easier monetary policy seems to be enough to keep stocks afloat near record highs. Plus, investors are gearing up for another earnings season and could be optimistic about the potential for another period of better-than-forecast corporate earnings.
Here We Go Again
Some earnings reports this week include Lennar Corporation LEN and KB Home KBH, both of which could offer an enlightening glimpse into the housing market from a corporate standpoint. As low interest rates have helped make homes more affordable and boosted new home sales, that demand has helped lead to a shortage in the supply of affordable homes. It could be interesting if executives give any sort of outlook on the housing supply issue.
Bed Bath & Beyond Inc. BBBY also opens its books this week. It could be interesting to see if executives there say anything more about the company’s future after the recently announced shake-up. The company’s shares saw a pop last month on news that six senior executives were leaving or had left the company. That news came after the stock had struggled this year but then regained some ground more recently. BBBY, in an effort to restructure the company, completed a sale-leaseback deal with a private equity firm.
Walgreens Boots Alliance Inc. WBA also reports earnings this week. After recent sluggish sales growth and stagnation in its share price—WBA was the laggard among Dow Jones Industrial Average components last year—analysts expect the company’s year-over-year earnings per share to drop.
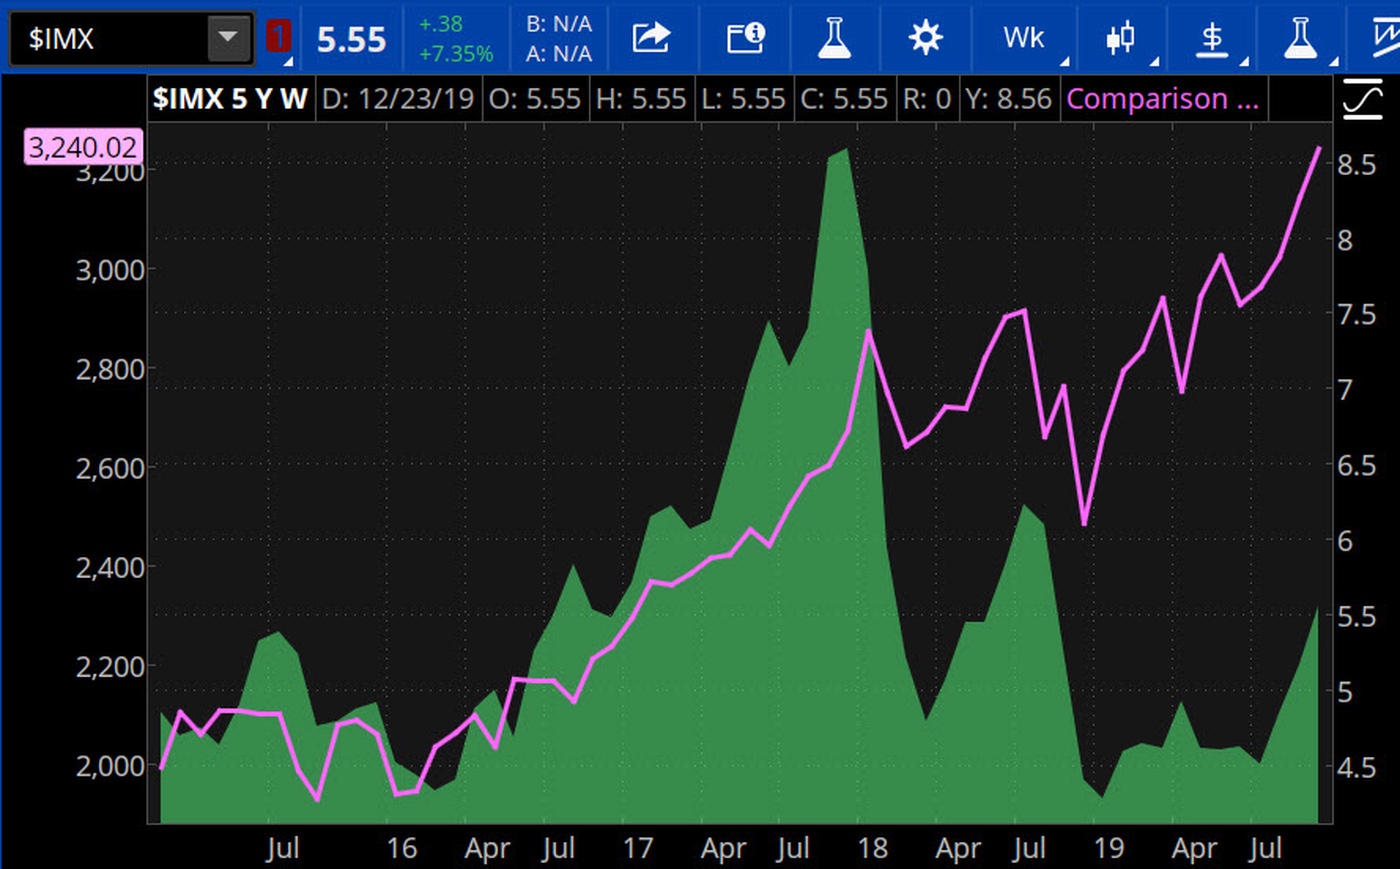
CHART OF THE DAY: SMOOTH MOVE. Last month, the Investor Movement Index® ($IMX - green shaded area) rose 7.4% to reach its highest point in more than a year, but well off the all-time high of 8.59, set back in December 2017. Investors were net buyers of equities amid strong retail industry news, encouraging Chinese industrial profit, and trade-deal optimism. However, the IMX began 2019 at its lowest level in six years (see more below), and was slow to climb despite the broad-based rally in stock indices such as the S&P 500 (SPX - purple line). Data source: TD Ameritrade, S&P Dow Jones Indices. Chart source: The thinkorswim® platform from TD Ameritrade. For illustrative purposes only. Past performance does not guarantee future results.
Looking Into the Investor’s Toolbox: Fresh numbers from TD Ameritrade’s Investor Movement Index® (IMXSM) came out yesterday, incorporating how clients were investing not only in December but in 2019 as a whole. The IMX is TD Ameritrade’s proprietary, behavior-based index, aggregating Main Street investor positions and activity to measure what investors actually were doing and how they were positioned in the markets.
While the IMX is just one tool in investors’ toolboxes, it can be useful for getting a pretty decent picture of what other market participants are doing because of its large sample size. That can help show you what others are buying and selling during a month and why, allowing you to compare your own strategy to that of your fellow investors.
IMX Hits Highest Point In 14 Months: In December, the IMX rose 7.4% month over month to 5.55, its highest point in 14 months, as the market rallied on strong retail industry news, encouraging industrial profit figures from China and optimism that a trade deal between the U.S. and China would get signed soon. TD Ameritrade clients were net buyers of equities during the month. It’s interesting to note that December’s figure was considered “Middle” compared with historic averages and marked the first time during 2019 that the reading wasn’t considered “Low” or “Moderately Low” (see chart above).
Roller Coaster Year for IMX: The strong end to the year was a marked difference from the beginning. The IMX entered 2019 at a six-year low amid heightened worries about global economic growth in light of the U.S.-China tariff situation. It rallied on optimism about a trade deal and low unemployment but then fell back on trade jitters. The IMX then rebounded, getting some help as investors reacted positively to another Fed rate cut in October and a generally stronger-than-expected earnings season. For the year, the five most popular stocks that TD Ameritrade clients net bought were Boeing Co BA, Walt Disney Co DIS, Occidental Petroleum Corporation OXY, AbbVie Inc ABBV, and CVS Health Corp CVS.
Information from TDA is not intended to be investment advice or construed as a recommendation or endorsement of any particular investment or investment strategy, and is for illustrative purposes only. Be sure to understand all risks involved with each strategy, including commission costs, before attempting to place any trade.
Image by Alessandro D'Andrea from Pixabay
© 2024 Benzinga.com. Benzinga does not provide investment advice. All rights reserved.
Date | ticker | name | Actual EPS | EPS Surprise | Actual Rev | Rev Surprise |
|---|
Trade confidently with insights and alerts from analyst ratings, free reports and breaking news that affects the stocks you care about.

