


For the first time in a while, it looks like there’s some optimism developing around the trade battle. It’s important not to get carried away, though, because we’ve been down this road before, where hope for progress eventually gets slammed by an official comment or tweet.
Hope this morning comes from the Chinese side. A spokesman for China’s Ministry of Commerce said China firmly rejects escalation of the trade war and is willing to negotiate with a “calm attitude,” CNBC reported.
Whether this means getting back to where we were last winter with regular talks—and occasional signs of progress—remains to be seen. But investors appear to be taking it that way. Stock futures rose 1% before the opening bell Thursday, and bond prices stepped back. The 10-year yield rose to near 1.5%, but it’s still slightly inverted with the two-year yield.
Investors received mixed earnings news this morning. The positive was Dollar General Corp DG beating expectations and raising guidance, sending its shares up more than 8% in pre-market trading and providing more signs of strength in the consumer sector. In this case, it’s the discount consumer sector, which tends to reflect how middle-class Americans are spending their money.
Best Buy Co Inc BBY shares fell after the company missed Wall Street’s revenue projection and delivered guidance for revenue that was below the third-party consensus range. That doesn’t mean there wasn’t stuff to like. BBY did beat earnings expectations and its revenue miss was pretty slim.
On the data front, the government’s second estimate for Q2 gross domestic product was pretty much in line with third-party consensus expectations at 2%, but down from the first estimate of 2.1%. GDP looked pretty good for the most part, but the China news is probably overtaking it as the news of the day. With all the twists and turns, it feels like this is going to be a week of the “news of the day.”
A lot more data are on tap as the week and month wrap up, including Personal Consumption Expenditure (PCE) prices (see more below), University of Michigan Sentiment, and Chicago PMI. All those are due tomorrow.
The Chicago PMI number might be particularly interesting, as it fell sharply to 44.4 in July from 49.7 in June. Any number below 50 indicates worsening conditions in Midwest manufacturing, and analysts are expecting another below-50 reading for August, according to Briefing.com. If this happens, it could raise new concerns about business confidence.
Don’t forget that when the market re-opens next Tuesday after Labor Day, another key measure of manufacturing demand—the ISM Manufacturing Index—will come out that morning. Construction spending also is due that day.
Stocks, Bonds Continue to Decouple
The massive bond rally we’re experiencing didn’t get in the way of Wednesday’s nice upward move for stocks, another sign that the two markets might be decoupling.
In a way, this has been happening all year. Consider that the S&P 500 (SPX) is up 15% year-to-date while the benchmark 10-year Treasury yield is down 45%, and you’ll see there’s nothing really new about Wednesday’s odd markets. Typically, bonds rise and yields fall when investors are concerned about the economic outlook, while stocks rise when investors are optimistic. Right now, both of those things are happening at the same time, though bonds did retreat a bit early Thursday on the positive trade news.
People appear determined to drive fixed income products higher and drive rates lower. It seems to have taken on a life of its own. There’s something kind of odd about it. It seems like it can’t be this easy to buy bonds, walk away, and see them go higher every day. Yet that’s exactly what’s been happening.
Wednesday’s bond strength could call into question the conviction behind the stock market’s rally on the same day. It was one of those days where stocks went up, but people might need some confirmation of the strength from today’s session. What we’re seeing in terms of risk premiums suggests that we’re going to need a lot more of a run-up in stocks for most people to really believe. The SPX remains entrenched in a relatively tight range that extends from roughly 2750 up to 3000. It’s been a month since it left that region.
One thing that could make trading particularly difficult is the approaching long weekend. Market volume tends to thin ahead of holidays, which can exacerbate moves—to the upside or the downside—and can cause some investors to question the market’s conviction.
Can Financials, Energy Maintain Wednesday’s Strength?
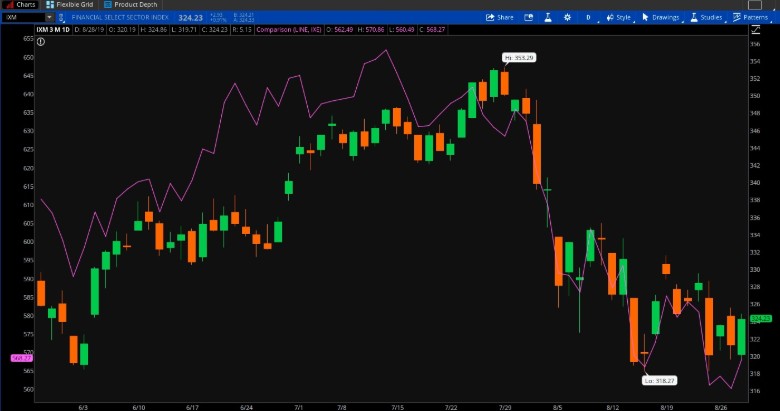
If you want an example of why Wednesday’s stock rally as 10-year yields crumbled below 1.5% turned some heads, consider the Financial sector. It was among the leaders on Wall Street despite falling yields, which often can make it harder for financial institutions to book profits. Theoretically, Financials should have been lower on a day like that.
The other thing raising eyebrows is continued strength in other “horsemen of risk” like volatility and gold. The Cboe Volatility Index (VIX) stayed just below 20 on Wednesday, not budging much from levels earlier in the week even as stocks climbed. Gold, meanwhile, slipped by just a couple of dollars an ounce and remains near six-year highs. It looks like many investors are keeping their cautious bets both within the bond market and outside of it. VIX did fall sharply early Thursday to just above 18.
The little rally on Wednesday in stocks might have been related to a much higher than expected U.S. weekly crude oil draw that gave Energy stocks a boost. It also could have had to do with the fact that yields didn’t really test some of the support at 1.35% for the 10-year and 1.9% for the 30-year. It was only one day, so we’ll see if those levels continue to hold. Any sign that yields might be carving a bottom would probably be welcomed by stock market bulls.
The other thing to consider is that a few sectors, including Energy and Financials, might be looking cheap to some investors. Both of those got driven down sharply over the last month, with Energy off by double-digits and Financials nearly that much. The overall market is only down 4%, perhaps making those sectors appear oversold to some.
Crude oil jumped sharply on Wednesday after the U.S. supply news, and sometimes a big crude draw can reflect strong industrial demand. There’s a lot of concern baked in about business spending right now, so any sign of growing demand for commodities like crude can work against the recession prognostications some analysts are making.
One counterpoint, however, is that some analysts said the drop in U.S. crude supplies might reflect a fall in Saudi Arabia’s exports. That would make it less of a demand-driven drop. Falling gasoline supplies, on the other hand, suggest strong transport demand.

Technology as a “Defensive” Investment?: When you think of “defensive” sectors, Technology doesn’t often come to mind. People tend to consider that a place to invest when they’re confident about the economy and stocks are generally on an upswing. “Defensive” sectors like Utilities and Staples are where investors tend to go at anxious times like these when they’re seeking yield and hoping for stability somewhere.
It could be time to re-think that particular philosophy. When you’re counting up the things people need every day—which Utilities and Staples traditionally represent—a lot of it is now also technology-related. With this in mind, it’s arguable that industries like IT services, software, and semiconductors could hold up well even in a downturn. Those core needs are part of the infrastructure for most companies, and they won’t necessarily be able to function without them even in a recession. That means demand could hold firm for technology products no matter what happens to the economy, just as it’s supposed to for essentials like shampoo and basic foodstuffs. When you’re talking about infrastructure, that is technology. If it’s infrastructure, it isn’t cyclical—it's something you have to have every day.
Eyeball This: Two factors to consider monitoring for signs of economic softness are weekly jobless claims and Q3 earnings growth estimates, analysts told financial media this week. As one analyst said on CNBC Wednesday, jobless claims tend to get overlooked by many investors, but can often be the first indication of things going the wrong direction. Initial claims, released every Thursday, have trended between 210,000 and 230,000 most of this year. If they head up, it could be a sign of businesses starting to feel economic pressure, possibly from the trade war. Any rise in job losses could threaten wage growth and consumer confidence. Claims of 215,000 this morning were up a bit, but in line with the recent range.
The other factor that may be worth a regular look is quarterly earnings estimates. Earlier this month, market research firm FactSet said analysts project a 3.1% year-over-year decline in Q3 earnings, with revenue growth of 3%. The next estimate from FactSet is due tomorrow, so we’ll see if anything changed. If earnings estimates remain stable, that’s arguably one less potential blow to stocks.
Price Watch: The Fed seems on pace to lower rates next month, according to the futures market. That means tomorrow’s Personal Consumption Expenditure (PCE) prices data might not matter all that much from a rate perspective, even though analysts say PCE prices are the Fed’s favorite inflation metric. Analysts expect a 0.2% rise in both the headline PCE and core PCE price figures Friday, compared with 0.1% for the June headline number and 0.2% for the June core number, according to Briefing.com. In June, year-over-year PCE prices rose 1.4% and core PCE rose 1.6%, both well below the Fed’s 2% inflation target. It could be interesting to watch this indicator as we go forward, because U.S. tariffs on China might start having an impact on many consumer goods in coming months. The question is whether companies will pass along those price increases, and many have told reporters that they will.
Information from TDA is not intended to be investment advice or construed as a recommendation or endorsement of any particular investment or investment strategy, and is for illustrative purposes only. Be sure to understand all risks involved with each strategy, including commission costs, before attempting to place any trade.
Image Sourced from Pixabay
© 2024 Benzinga.com. Benzinga does not provide investment advice. All rights reserved.
Date | ticker | name | Actual EPS | EPS Surprise | Actual Rev | Rev Surprise |
|---|
Trade confidently with insights and alerts from analyst ratings, free reports and breaking news that affects the stocks you care about.

