


After a volatile week, investors are likely to be in wait-and-see mode as the new week kicks off in the red and earnings season remains front and center. After Bank of America Corp. BAC reported this morning, Morgan Stanley MS and Goldman Sachs Group Inc. GS will round out earnings from the big banks, with both scheduled to release results before market open on Tuesday, Oct. 16.
First off, many investors will likely be parsing through their reports to get a better idea on the overall state of the economy. Some of the big banks that have reported so far, like JP Morgan Chase & Co. JPM and Wells Fargo & Co. WFC, have touted a strong economy, although that didn’t necessarily translate into robust loan growth.
Since there are a lot of question marks that could impact global business, it seems like many analysts have been emphasizing management outlook more so than they have in the past. This will also be the first quarterly earnings release where new CEO David Solomon is at the helm for GS, so investors might be looking for some more info about future strategy from Lloyd Blankfein’s successor.
In terms of company divisions, third-party analysts are widely expecting equities trading divisions to get a boost, while fixed income, currencies and commodities (FICC) trading is expected to continue to weigh on results.
On average, many analysts are expecting MS’ equity trading revenue to increase 5 percent year over year to $1.99 billion, while FICC trading is projected to come in flat at $1.17 billion. For GS, analyst consensus is expecting equity trading revenue to increase 4.2 percent year over year to $1.74 billion, and FICC trading revenue is projected to come in close to flat at $1.45 billion.
Investment banking divisions will likely be another area of interest, as the deal-making and IPO environment is typically highly dependent on a strong economy and markets, and less overall uncertainty.
Morgan Stanley Earnings and Options Activity
For Q3, MS is expected to report adjusted EPS of $1.02, up from $0.93 in the prior-year quarter, on revenue of $9.56 billion, according to third-party consensus analyst estimates. Revenue is projected to increase 4 percent year over year.
Morgan Stanley in 2018. MS recently broke through support in the low-$46 range, which had been a level it had bounced off a couple of times since the start of June. Heading into tomorrow’s report, the stock is trading not too far from its 52-week low of $42.88. Chart source: thinkorswim® by TD Ameritrade. Not a recommendation. For illustrative purposes only. Past performance does not guarantee future results.

Options traders have priced in about a 3.8 percent stock move in either direction around Tuesday’s report, according to the Market Maker Move indicator on the thinkorswim® platform. Implied volatility was on the high end as of this morning, hovering around the 81st percentile.
At the Oct. 19 monthly expiration, short-term options trading on the call side has been concentrated at the 43 and 43.5 strike prices. On the put side, recent volume has been heavier at the 43. 43.5 and 44 strikes, with high open interest at the 45-strike put as well.
Looking at the Nov. 16 monthly expiration, recent trading on the call side has been heavier at the 45, 46 and 47 strikes. There’s a lot of open interest from the 47 strike up to the 52.5 strike, which was around the range the stock had been trading at from the end of May up until the start of October, when it broke through support at the low-$46 level.
Note: Call options represent the right, but not the obligation, to buy the underlying security at a predetermined price over a set period of time. Put options represent the right, but not the obligation to sell the underlying security at a predetermined price over a set period of time.
Goldman Sachs Earnings and Options Activity
GS is expected to report adjusted EPS of $5.38 on revenue of $8.4 billion, according to third-party consensus analyst estimates. In the same quarter last year, GS reported adjusted EPS of $5.02 on revenue of $8.33 billion.
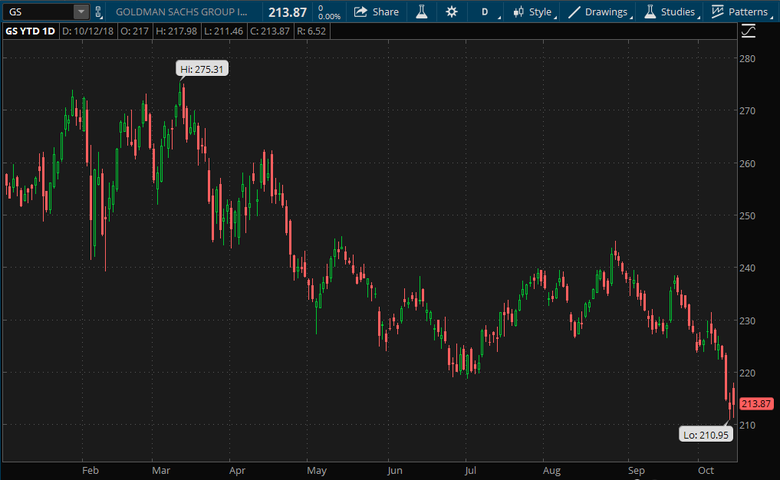
Goldman Sachs 2018 Stock Chart. GS recently broke through the $220 level, where it had seen some support over the past several months. The stock remains well off its 2018 high of $275.31, and is trading close to its 52-week low of $210.95 ahead of tomorrow’s report. Chart source: thinkorswim® by TD Ameritrade. Not a recommendation. For illustrative purposes only. Past performance does not guarantee future results.
Around GS’ earnings release, options traders have priced in about a 3.5 percent stock move in either direction, according to the Market Maker Move indicator. Implied volatility was at the 71st percentile as of this morning, about the same level most of the big banks that reported last week were at leading up to their reports.
In recent trading at the Oct. 19 monthly expiration, calls have been active at the 215, 220, and 225 strike prices. Volume has been lighter on the put side and concentrated at the 215 and 217.5 strikes. Again, there’s a lot of open interest for calls at strike prices well out of the money, around the 230 to 250 strikes, where the stock had been trading closer to from mid-July up until the end of September.
Further out at the Nov. 16 monthly expiration, there has been a smattering of activity on both the call and put side, with no strikes standing out.
What’s Coming Up
Earnings season is starting to kick into high gear this week and the next four weeks will bring the busiest stretch of reports. Some of the other major financials reporting this week include BlackRock, Inc. BLK, US Bancorp USB, American Express Company AXP, PayPal Holdings Inc. PYPL. And after the close tomorrow, Oct. 16, both Netflix, Inc. NFLX and IBM IBM are slated to report.
Outside of earnings, there’s a lot more happening: escalating geopolitical tensions, ongoing Brexit negotiations and the evolving trade situation. Make sure to check out today’s Market Update for an overview of the big stories.
Information from TDA is not intended to be investment advice or construed as a recommendation or endorsement of any particular investment or investment strategy, and is for illustrative purposes only. Be sure to understand all risks involved with each strategy, including commission costs, before attempting to place any trade.
© 2024 Benzinga.com. Benzinga does not provide investment advice. All rights reserved.
Date | ticker | name | Actual EPS | EPS Surprise | Actual Rev | Rev Surprise |
|---|
Trade confidently with insights and alerts from analyst ratings, free reports and breaking news that affects the stocks you care about.

