


A selloff apparently driven by international trade worries may have gotten a bit overdone, providing the market a chance to bounce back this morning.
After Asian and European markets traded higher, U.S. equities futures were also in the green, apparently helped by a rebound in oil prices and news on the M&A front that may have kindled some optimism about the economy and market.
The bounce comes a day after stocks and commodities tumbled following an escalation in the U.S.-China trade dispute.
On the M&A Beat
Comcast Corporation CMCSA upped its bid for UK-based media giant Sky Plc to top a rival bid from Twenty-First Century Fox inc. FOXA. The latest offer is $34 billion. This is the latest twist in a multi-player media saga, as “old guard" media heavyweights appear to be looking to fend off competition from digital upstarts such as Netflix, Inc. NFLX. Recall that Walt Disney Co. DIS is in the process of a potential $71 billion deal for a large chunk of FOXA.
Meanwhile, chipmaker Broadcom Inc. AVGO agreed to buy IT software provider CA Technologies (CA - formerly Computer Associates), for $18.9 billion in cash, in a deal that has many analysts seemingly scratching their heads, given the divergence between the two companies’ infrastructure and culture. However, Broadcom CEO Hock Tan explained the deal by stating CA’s “mainframe and enterprise software franchises will add to our portfolio of mission critical technology businesses." Plus, CA does hold over 1500 patents, according to industry sources. Some analysts say Broadcom was itching for a deal of some kind, after its recently-failed takeover bid for Qualcomm, Inc. QCOM.
Stocks, Commodities Take a Hit
An escalation in the ongoing U.S.-China trade dispute appeared to pressure stocks on Wednesday, with all three major U.S. indices falling substantially into the red.
The declines came after the Trump administration threatened $200 billion in new tariffs on Chinese goods in addition to the $34 billion in tariffs each nation put into effect on the other last week. The escalating business tensions between the world’s two largest economies seem to have had Wall Street on edge for months as many investors appear to be worrying about the trade dispute crimping global growth.
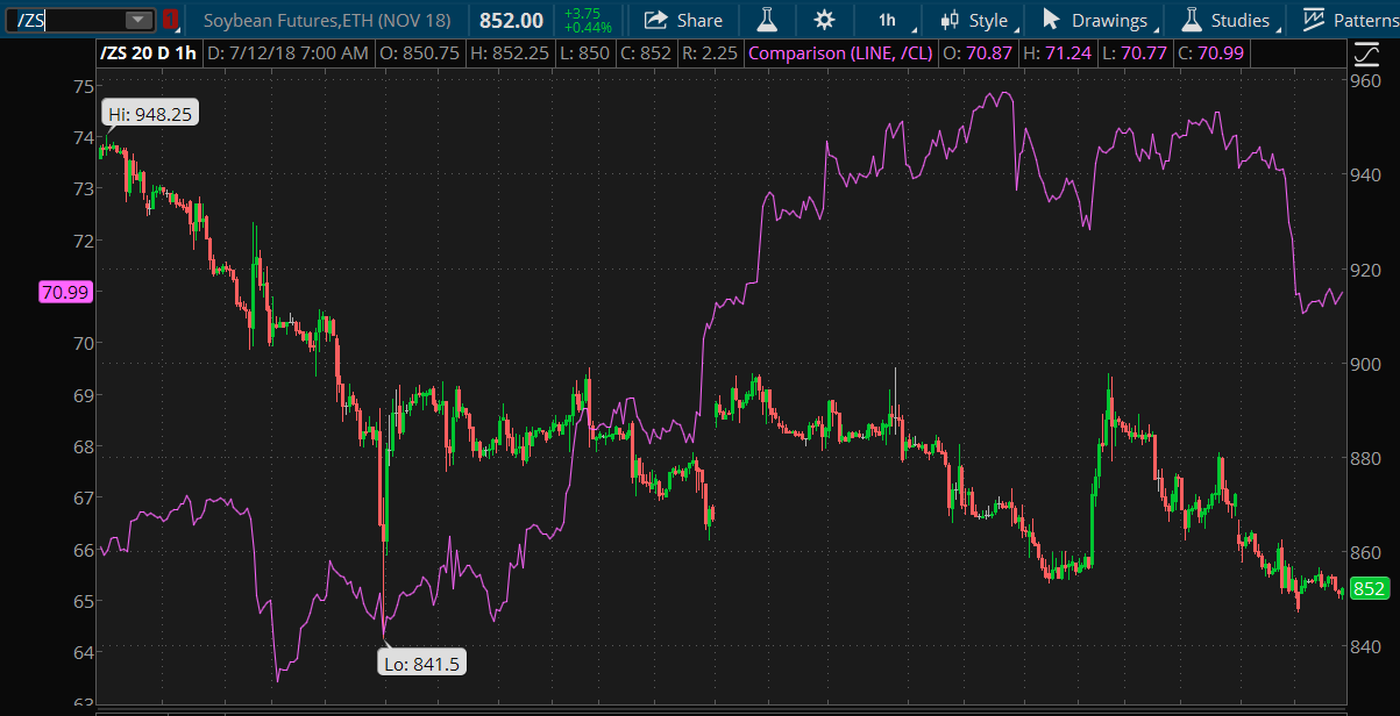
Expectations of diminished economic growth also seemed to hit the raw materials markets, with commodities such as soybeans and crude oil falling sharply (see figure 1 below). The fall in crude appeared to help pressure oil stocks, and the energy sector was the biggest loser among S&P 500 (SPX) sectors, registering a 2.15 percent drop. Bearish supply news from Libya and Saudi Arabia also seemed to pressure the commodity despite news of a decline in U.S. inventories.
Gains in the U.S. dollar as investors apparently wanted its perceived relative safety also pressured dollar-denominated commodities – including gold, also considered a haven asset – which tend to move inversely with the greenback. Demand for Treasuries, also viewed as a haven in times of uncertainty, also rose Wednesday. Utilities, which are often considered a defensive investment in times of market turmoil, was the only S&P 500 sector in the green.
The risk off mood appeared to help elevate the Cboe Volatility Index (VIX), the market’s so called “fear gauge,” above 13.6. But the measure still remains relatively low compared to last month’s high above 18.
FIGURE 1: COMMODITIES VOLATILITY. Raw materials such as soybeans (candlestick chart) and crude oil (purple line) have had quite a volatile month, as economic and trade uncertainty drive uncertainty in supply and demand expectations. Data source: CME Group. Chart source: The thinkorswim® platform from TD Ameritrade. For illustrative purposes only. Past performance does not guarantee future results. Chart Source: The thinkorswim platform from TD Ameritrade. For illustrative purposes only. Past performance does not guarantee future results.
Talking About the Yield Curve
Why are so many people on Wall Street talking about the yield curve? And what is it for that matter? Let’s answer the last question first, focusing on the U.S. Treasury market. The yield curve shows the spread between the yield on short-term and long-term maturities. Usually, the curve steepens the longer the time frame as Treasuries with shorter maturities tend to yield less than those with longer maturities. The yield curve is usually positive when the economy is growing, and economic growth typically leads to increasing corporate profits and rising stock prices. But recently, the curve has been flattening. The yield on the 10-year Treasury has been on either side of 3percent even as the Federal reserve pushes up its ultra-short term federal-funds rate. Now to answer the first question. The flattening of the yield curve appears to have alarmed some on Wall Street because of worry that it might invert, a potential warning sign for stock investors because it tends to signal possible slowing corporate profits and a potential fall in stock prices. Some worry an inverted yield curve could precede a recession. A flattening yield curve is also a potential headwind for the financial sector, as a flatter curve can pressure banks’ net interest margin—the spread between what banks earn on loans and what they pay on deposits.
Tariffs and Inflation
Inflation is one reason investors may want to keep an eye on the prices of goods the United States imports. And the escalating trade kerfuffle between the United States and China could compound that. It remains to be seen how the administration’s tariffs on aluminum and steel from the European Union, Canada and Mexico, which went into effect on June 1, will affect import prices, as the market won’t get the June reading on import prices until Friday. And investors may want to watch the July report as it will be the first after $34 billion in U.S. tariffs on Chinese goods went into effect. Overall, U.S. import prices have been on the rise, and it could be worth watching as to whether international trade disputes will accelerate that.
More Pressure for Soybeans?
Soybeans have been one of the targets in the tit-for-tat trade dispute between the U.S. and China. Last week, the Asian nation slapped tariffs on imports of U.S soybeans, as well as other goods, in retaliation for $34 billion in U.S. tariffs on Chinese imports. Chicago Board of Trade futures on the protein-rich legume have been under pressure since China said in April that it would retaliate against any U.S. tariffs, according to a Friday post by Warren Patterson, commodities strategist with ING. Now, U.S. soybeans are cheap enough that they may be affordable enough for the Chinese market even with the tariffs, he wrote. But if China jacks up the soybean tariffs in retaliation to the threatened $200 billion in additional U.S. tariffs, that could pressure prices further, Patterson said in an email. “The bigger the tariff increase the more downside that leaves for CBOT soybeans,” he said. A hike to 30percent would mean CBOT soybeans would need to trade no higher than $8.30 per bushel to be workable in China, he said. If China increases the tariff to 35percent, that could mean CBOT soybeans could fall below $8 bushel, he said. The most active CBOT soybean contract was trading at about $8.50 this morning.
Information from TDA is not intended to be investment advice or construed as a recommendation or endorsement of any particular investment or investment strategy, and is for illustrative purposes only. Be sure to understand all risks involved with each strategy, including commission costs, before attempting to place any trade.
© 2024 Benzinga.com. Benzinga does not provide investment advice. All rights reserved.
Date | ticker | name | Actual EPS | EPS Surprise | Actual Rev | Rev Surprise |
|---|
Trade confidently with insights and alerts from analyst ratings, free reports and breaking news that affects the stocks you care about.

