


This June Swoon has been a tough one with investors getting more than a little battered and beaten by the bears. However, even with stocks falling and increased talk about recession, the markets haven’t experienced what people would call “panic selling.”
As we head into July, the upcoming summer earnings season will provide more insight into how companies are dealing with increasing inflation and rising interest rates. By month’s end, investors will likely see another rate hike from the Fed.
So, what can investors expect as they navigate bear country that’s likely to continue in July?
Bear Country
The S&P 500 (SPX) hit bear market territory June 13 after falling more than 20% from its all-time high—two days before the Fed’s more-aggressive-than-planned 75-basis-point rate. The Nasdaq Composite ($COMP) had already been in bear market territory for some time, and it declined even further after the Fed’s move, falling nearly 30% so far in June. The Dow Jones Industrial Average ($DJI) still hasn’t made it into bear territory, but as of today’s date, it’s down 15%. Investments hit a bear market after falling 20% from their all-time highs.
As we’ve all been traveling through bear country in some form, many analysts have said that it doesn’t “feel like a bear market” or it doesn’t “feel like a recession.” Those feelings appear to be reflected in their stock ratings. A recent study from FactSet found that analysts have an “unusually” high number of buy ratings for stocks in the S&P 500. Of the 10,708 ratings on stocks in the index, FactSet said 56.9% are rated buy, 37.7% are hold, and 5.4% are sell. This is above the 5-year average of 53.3% for buy ratings.
FactSet also found that analysts remain most bullish on the technology, energy, and communication services sectors, but they’re bearish on consumer staples. Yet aren’t all industries facing higher inflation, rising interest rates, a rising likelihood of recession, fallout from the Russia-Ukraine war, and isn’t the S&P 500 still in a bear market?
Wouldn’t it seem reasonable that analysts would be downgrading more stocks?
Many analysts have yet to revise their price targets for the S&P 500. If the benchmark index was to reach these current price targets, it would have to rally 40% by the end of the year. It’s difficult to say what is driving such bullishness among analysts. Perhaps some are behind the curve, or maybe they really are expecting stocks and the economy to bounce back during 2022’s second half.
One reason for the bullishness could be that the S&P 500 bear market has been orderly and without the kind of panic selling I mentioned above. Such selling would trigger trading curbs at the exchanges, and that hasn’t happened. It’s fair to say that several individual stocks have experienced panic selling. But the overall market hasn’t.
Instead, as the 10-year Treasury yield (TNX) has risen, stocks have been methodically revalued by investors and prices have adjusted accordingly.
That’s not to say that there haven’t been times when stocks were oversold. But the lack of widespread panic selling could suggest that the bear market has more room to fall because there hasn’t been a point known as “capitulation” that marks a surrender by speculators who essentially give up and sell, which in turn attracts longer-term investors looking for value.
What might capitulation look like? It would likely coincide with the Cboe Volatility Index (VIX) spiking above 40. The question is, can stocks rise without a capitulation point?
One sign that the bear market may continue is that investors still appear to be risk-averse. The Russell 2000 (RUT) has led the bear market starting back at the end of 2021, falling as much as 32% from its all-time high. Recently, the RUT broke a significant support level by falling below its 1999 and 2000 highs—and that may be a sign that the boarder market could move lower.
That Recession Feeling
While bear markets often precede a recession, not every bear market is followed by one.
Historically, a recession has been defined by two consecutive quarters of negative gross domestic product (GDP). During 2022’s first quarter, analysts expected to see the economy grow as pandemic restrictions were lifted, people got back to work, the supply chain shored up, and the economy moved closer to normal. Instead, the United States saw GDP turn negative by 1.3%.
So now it’s a waiting game—but not without some important signals.
As of May 18, the Atlanta Fed’s GDPNow tool estimated Q2 GDP to grow at 2.4%. By May 25, just a week later, it adjusted lower to 1.8%. On June 16, it was lowered again to 0.9%. After the Fed raised rates on June 15, it was lowered to 0.0%. As of Monday, it had bounced up to an estimated 0.3 on GDPNow. And on Tuesday, May U.S. trade deficit numbers came in lower for the second month in a row, which would be considered a boost for GDP.
If final Q2 GDP is negative, then the United States will experience two straight quarters of negative GDP, which has historically been considered a recession.
But it’s not just the GDPNow tool movements evaluating the likelihood of a recession. Analysts at major financial firms have raised their recession probabilities as well. In the last two months, BofA Securities, Deutsche Bank (DB), Moody’s Analytics, and Goldman Sachs (GS) have reported a higher likelihood of recession. In the last few days, Citigroup (C) increased their probability of a recession to 50%. Even an economist from the Fed has increased the odds of a recession.
Obviously, no one knows the future, but a falling market and a rising VIX tend to add up to greater investor uncertainty.
Earnings Preview
The summer earnings season will be here soon. The unofficial kickoff starts the week of July 11 with several large banks reporting. According to FactSet, the estimated Q2 earnings growth for the S&P 500 is 4.3%, the lowest growth rate since Q4 2020. Between March 31 and June 15, the estimated growth rate fell from 5.9% to 4.3% due to analysts’ revisions. FactSet said that 72 of the S&P 500 companies have issued negative earnings guidance against 31 positives.
A few major banks offered up a preview on Monday. After the Federal Reserve announced last week that the nation’s 34 largest banks passed the central bank’s annual stress test, allowing each to redistribute excess capital to shareholders, dividend announcements started coming in.
Early activity suggests a more mixed dividend picture than 2021, when banks had accumulated excess cash that year to cover loan losses that never materialized. After the closing bell, Citigroup (C) and JPMorgan Chase (JPM) kept their dividends unchanged, while Bank of America (BAC) raised its payout 5% and Morgan Stanley (MS) increased its dividend 11% and announced a $20 billion share buyback. Goldman Sachs (GS) made the largest dividend increase announcement of all on Monday, a raise of 25%.
As of last week, net earnings revisions were negative around the globe, according to Yardeni Research. The three-month moving average of forward earnings revisions for the MSCI All Country World Index has seen net negative revisions for Q1 and Q2 going through the end of May. When excluding U.S. stocks, the revisions are even more negative.
The net earnings revisions for the S&P 500 have fallen dramatically since 2021 but remain net positive. Additionally, the S&P 500 saw an increase in net revisions from April to May. Similarly, Europe has also seen a dramatic decrease in net revisions but remains positive despite slipping into the negative in April.
Yardeni also found that emerging markets are seeing negative revisions getting increasingly worse, particularly in countries like China and India. Surprisingly, Russia’s revisions remain positive despite its ongoing war with Ukraine and sanctions from the United States and much of Europe. Latin America is also seeing positive revisions too, particularly in Mexico and Peru.
However, in the last few quarters, both Refinitiv and FactSet have reported that the number of companies beating earnings and revenue estimates declined. Additionally, the margin at which companies were beating earnings and revenue estimates have shrunk. The Q4 2021 and Q1 2022 themes of higher input costs, inflation, supply chain problems, and pricing power are likely to continue as companies start reporting. Investors will be looking for a light at the end of the tunnel during earnings calls—or more darkness.
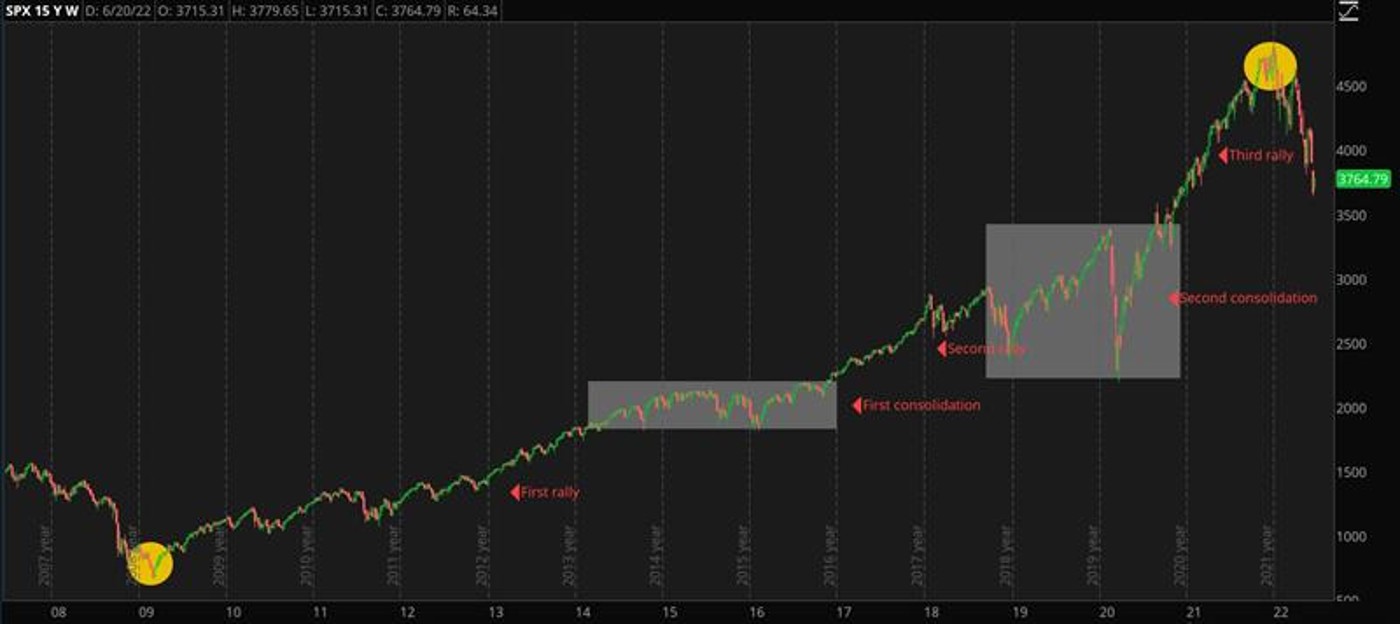
CHART OF THE DAY: HUNTING FOR BEAR. Since the S&P 500 (SPX—candlesticks) hit a bottom in 2009, it has experienced three major rallies and two consolidations—the second briefly hitting bear territory—before the recent bear market. Data Sources: ICE, S&P Dow Jones Indices. Chart source: The thinkorswim® platform. For illustrative purposes only. Past performance does not guarantee future results.
Market Cycle
As we try to make sense of the current bear market, we may gain insights from technical analysis. Many technicians have found that the secular trend—the longest-term trend—follows a market cycle that goes from bull market to bear market and commonly consists of eight major movements. The bull market usually has five movements: a rally, a consolidation, a second rally, a second consolidation, and one final rally before reaching its peak. A bear market commonly has three movements: a sell-off, a consolidation, and a sell-off before reaching a bottom.
Of course, past performance isn’t an indicator of future results, and sometimes the patterns used in technical analysis are much easier to identify after the fact. Looking at a chart of the S&P 500 over the last 15 years, the last bear-market bottom occurred in 2009 when the credit crisis bear market ended and a new bull market started in 2009.
The first rally lasted about six years. Then the S&P 500 traded sideways or consolidated for about two years. Remember that rallies and consolidations will often overlap. The next rally was nearly four years before a very volatile consolidation, which included a relatively short bear market that took the S&P 500 down more than 20% due to the COVID-19 pandemic. Once the index turned around, the third rally occurred. This rally is commonly characterized by its fast growth and broad appeal that brings in many novices and first-time investors. This is the time that the savviest investors are reducing their positions, selling into the rallies, and looking for investment opportunities elsewhere.
If 2022 marked the end of the secular bull market—assuming this pattern holds—the first bear movement of the secular trend may have started around the first of the year. The first sell-off tends to be orderly, and the majority of investors remain bullish. That sell-off tends to be followed by a consolidation or rally where many investors hold the belief that the “worst is behind us.” During the Great Depression, this rally lasted nearly six months and the S&P 500 rose almost 50%.
The final sell-off tends to be the most difficult because it’s often characterized by panic selling and capitulation. Again, we haven’t seen this so far, but this is usually when latecomers of the third rally sell with large losses. However, as capitulation occurs and stock investing becomes unpopular, the savviest investors often start to accumulate shares once again, eventually forming the next bottom.
Whether this model holds or even applies to the current situation is up for debate. But what we can gather is that historically investors who kept a long-term perspective and a diversified portfolio have been able to ride through the ups and downs long enough to get back to the ups.
It also helps to know how rough the ride may get.
Finally, this model may provide some insight on how investors might be feeling and how others may be viewing and reacting to the market.
July Fed Meeting
At the June Federal Reserve meeting, the Federal Open Market Committee (FOMC) was faced with a hotter-than-expected Consumer Price Index (CPI) that showed inflation was still near historic highs. The committee decided to move away from its plan for a 50-basis-point hike to 75 basis points, which lifted the federal funds rate to a range between 1.5% to 1.75%.
Fed Chairman Jerome Powell told reporters immediately afterward that the 75-basis-point hike isn’t expected to be a common increase, and that the Fed will likely hike 50 to 75 basis points in July with a return to increases in the 25- to 50-basis-point range thereafter.
Powell cautioned that all future hikes will be “data-dependent,” but the Fed’s accompanying dot plot revealed that each Fed member sees the central bank’s overnight rate reaching at least 3% by the end of 2022 with the average projection at 3.4%.
During Powell’s June 22 meeting with the Senate Banking Committee, he said that the United States needs to get rates back to neutral, meaning that real yields should be at least zero. A real yield of zero means that the 10-year Treasury yield (TNX) will have a return equal to the pace of inflation and equal to the CPI’s year-over-year growth.
The Fed began to reduce its balance sheet in mid-June, unloading an initial total of $30 billion in Treasuries and $17.5 billion in mortgage-backed securities. In July, the amount of quantitative tightening (QT) will ramp up and continue to increase over the next two months to an eventual pace of $60 billion in Treasuries and $35 billion in mortgage-backed securities.
The ongoing concern with QT is that it may add more volatility to an already volatile Treasury market. The Treasury market and the mortgage market are now losing one of their biggest customers and will have to rely on other institutions and investors to pick up the slack. Those replacing the Fed’s business may demand a higher rate of return, which could push yields even higher.
The Fed’s June rate hike appeared to have caused currency concerns around the globe as the stronger dollar was threatening the value of other currencies. The Swiss National Bank (SNB) and the Bank of England (BoE) immediately responded to the Fed’s hike with hikes of their own as a way to bolster their respective currencies. Central banks in Brazil, Saudi Arabia, Kuwait, United Arab Emirates, Qatar, and Bahrain also raised rates. In fact, in the last six months, nearly four dozen central banks have raised key rates, according to The New York Times.
While the Fed is expected to raise its key rate another 75 basis points on July 26, a new issue may arise in a sort of currency war as other nations continue raising rates to keep pace with the dollar. This could threaten these economies with a higher cost of capital that could fuel a global recession. On the other hand, if more countries raise rates, it could help weaken the dollar and reduce some of the currency headwinds faced by U.S.-based multinational companies that have pressured their earnings.
However, if the dollar continues to strengthen, multinationals could continue to struggle and pull large- and mega-cap stocks lower.
Conclusion
Now that June is nearly wrapped up, is the swoon over? According to the Stock Trader’s Almanac, July has historically been a stronger month for stocks. If companies have a good earnings season or even if they’re able to see an end to the inflation spiral, then July could help the markets trim June’s serious losses.
TD Ameritrade® commentary for educational purposes only. Member SIPC.
Image sourced from Shutterstock
This post contains sponsored advertising content. This content is for informational purposes only and not intended to be investing advice.
© 2024 Benzinga.com. Benzinga does not provide investment advice. All rights reserved.
Trade confidently with insights and alerts from analyst ratings, free reports and breaking news that affects the stocks you care about.

