


PayPal Holdings, Inc PYPL spiked higher on Friday after Josh Brown and Kari Firestone said on CNBC’s "Halftime Report" the stock is a buy at current levels.
Brown went on to say PayPal will transform from a payments service company to a “financial super app” that could provide services from lending and trading to insurance. PayPal has “lost $60 billion in market cap over the past few months,” Brown said, while Firestone finished the segment by saying she believes the stock could be valued as high as $1 trillion in the future.
PayPal has a lot of work to do to reach that market cap, but it does appear the stock may have found a bottom and is set to reverse course.
See Also: CNBC's Final Trades: Corteva, Vale, Roblox And Paypal
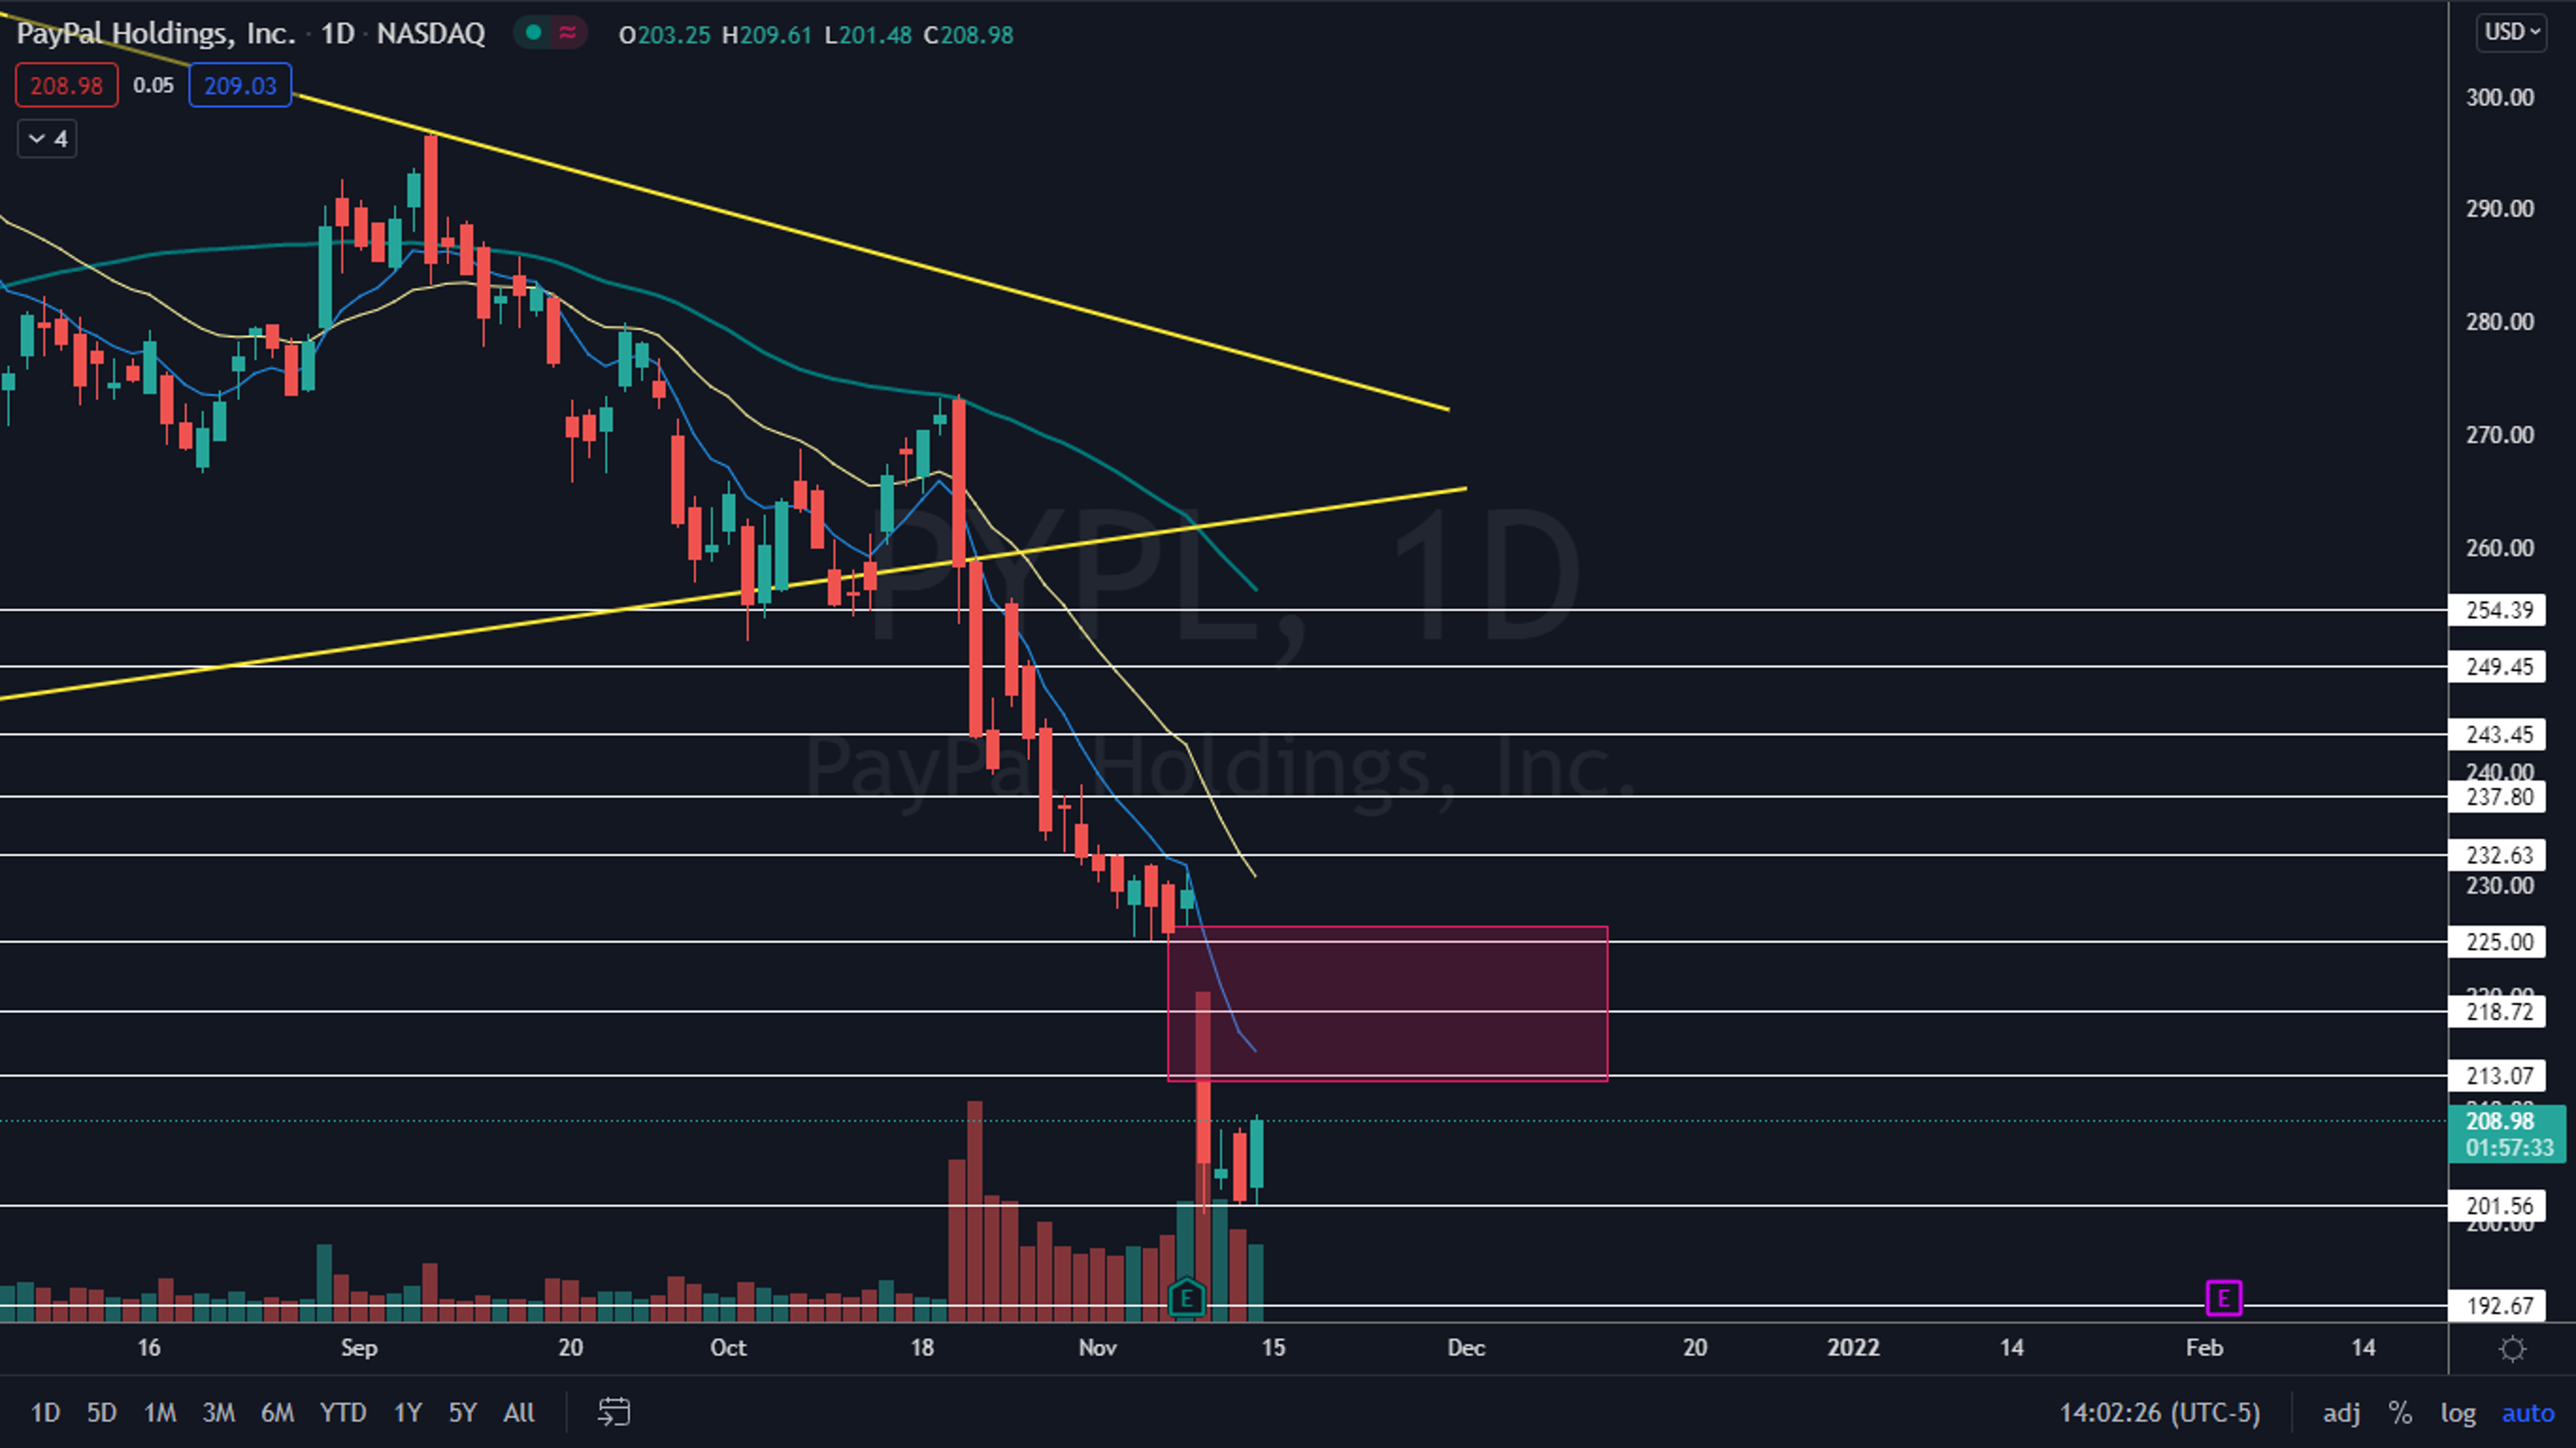
The PayPal Chart: PayPal created a bullish double bottom pattern near the $201.56 level on Tuesday and Thursday on the daily chart. On Friday, the stock retested the level as support, which created a triple bottom pattern and bounced up over 3% surpassing Thursday’s high-of-day.
Technical traders may have seen the bounce coming because PayPal’s relative strength index (RSI) has been measuring below 30% for the past five trading days. When a stock’s RSI reaches or exceeds the 30% level it becomes oversold, which can be a buy signal for technical traders.
PayPal has a gap above between $212.40 and $226.25 that was left behind on Nov. 9 when the stock suffered a bearish reaction to its earnings print. Gaps on charts fill about 90% of the time so it’s likely PayPal will trade back up to fill the range in the future.
On Friday afternoon PayPal was printing a bull flag on the hourly chart, which indicates the stock may trade higher into the bell. The pole of the hourly bull flag was created between 9:30 a.m. EST and 11:30 and the flag was forming during the two hours that followed. If the pattern is recognized the measured move is about 4%, which indicates PayPal could run up toward the $215 level late in Friday’s session or early on Monday’s.
PayPal is trading well below the eight-day and 21-day exponential moving averages (EMAs), with the eight-day EMA trending below the 21-day, both of which are bearish indicators. The stock is also trading below the 50-day simple moving averages, which indicates longer-term sentiment is bearish.
Want direct analysis? Find me in the BZ Pro lounge! Click here for a free trial
- Bulls want to see big bullish volume come in and push PayPal up over the Nov. 9 high and into the gap. There is resistance above at $213.07 and $218.72.
- Bears want to see big bearish volume come in and push PayPal down below the $201.56 level. Below the area, there is psychological support at $200 and price history support at $192.67.

© 2024 Benzinga.com. Benzinga does not provide investment advice. All rights reserved.
Trade confidently with insights and alerts from analyst ratings, free reports and breaking news that affects the stocks you care about.

