


Ford Motors Co F announced Wednesday it's working with Purdue University to research and develop a new patent-pending charging cable that could make recharging electric vehicles as quick as filling up with gas.
Today, drivers are limited as to how quickly they can recharge their electric vehicles due to the danger of overheating as the electric current flows through the cable. Ford and Purdue intend to use liquid as a cooling agent, in a new type of cable, to make charging more seamless and practical, which may attract more customers to the EV market.
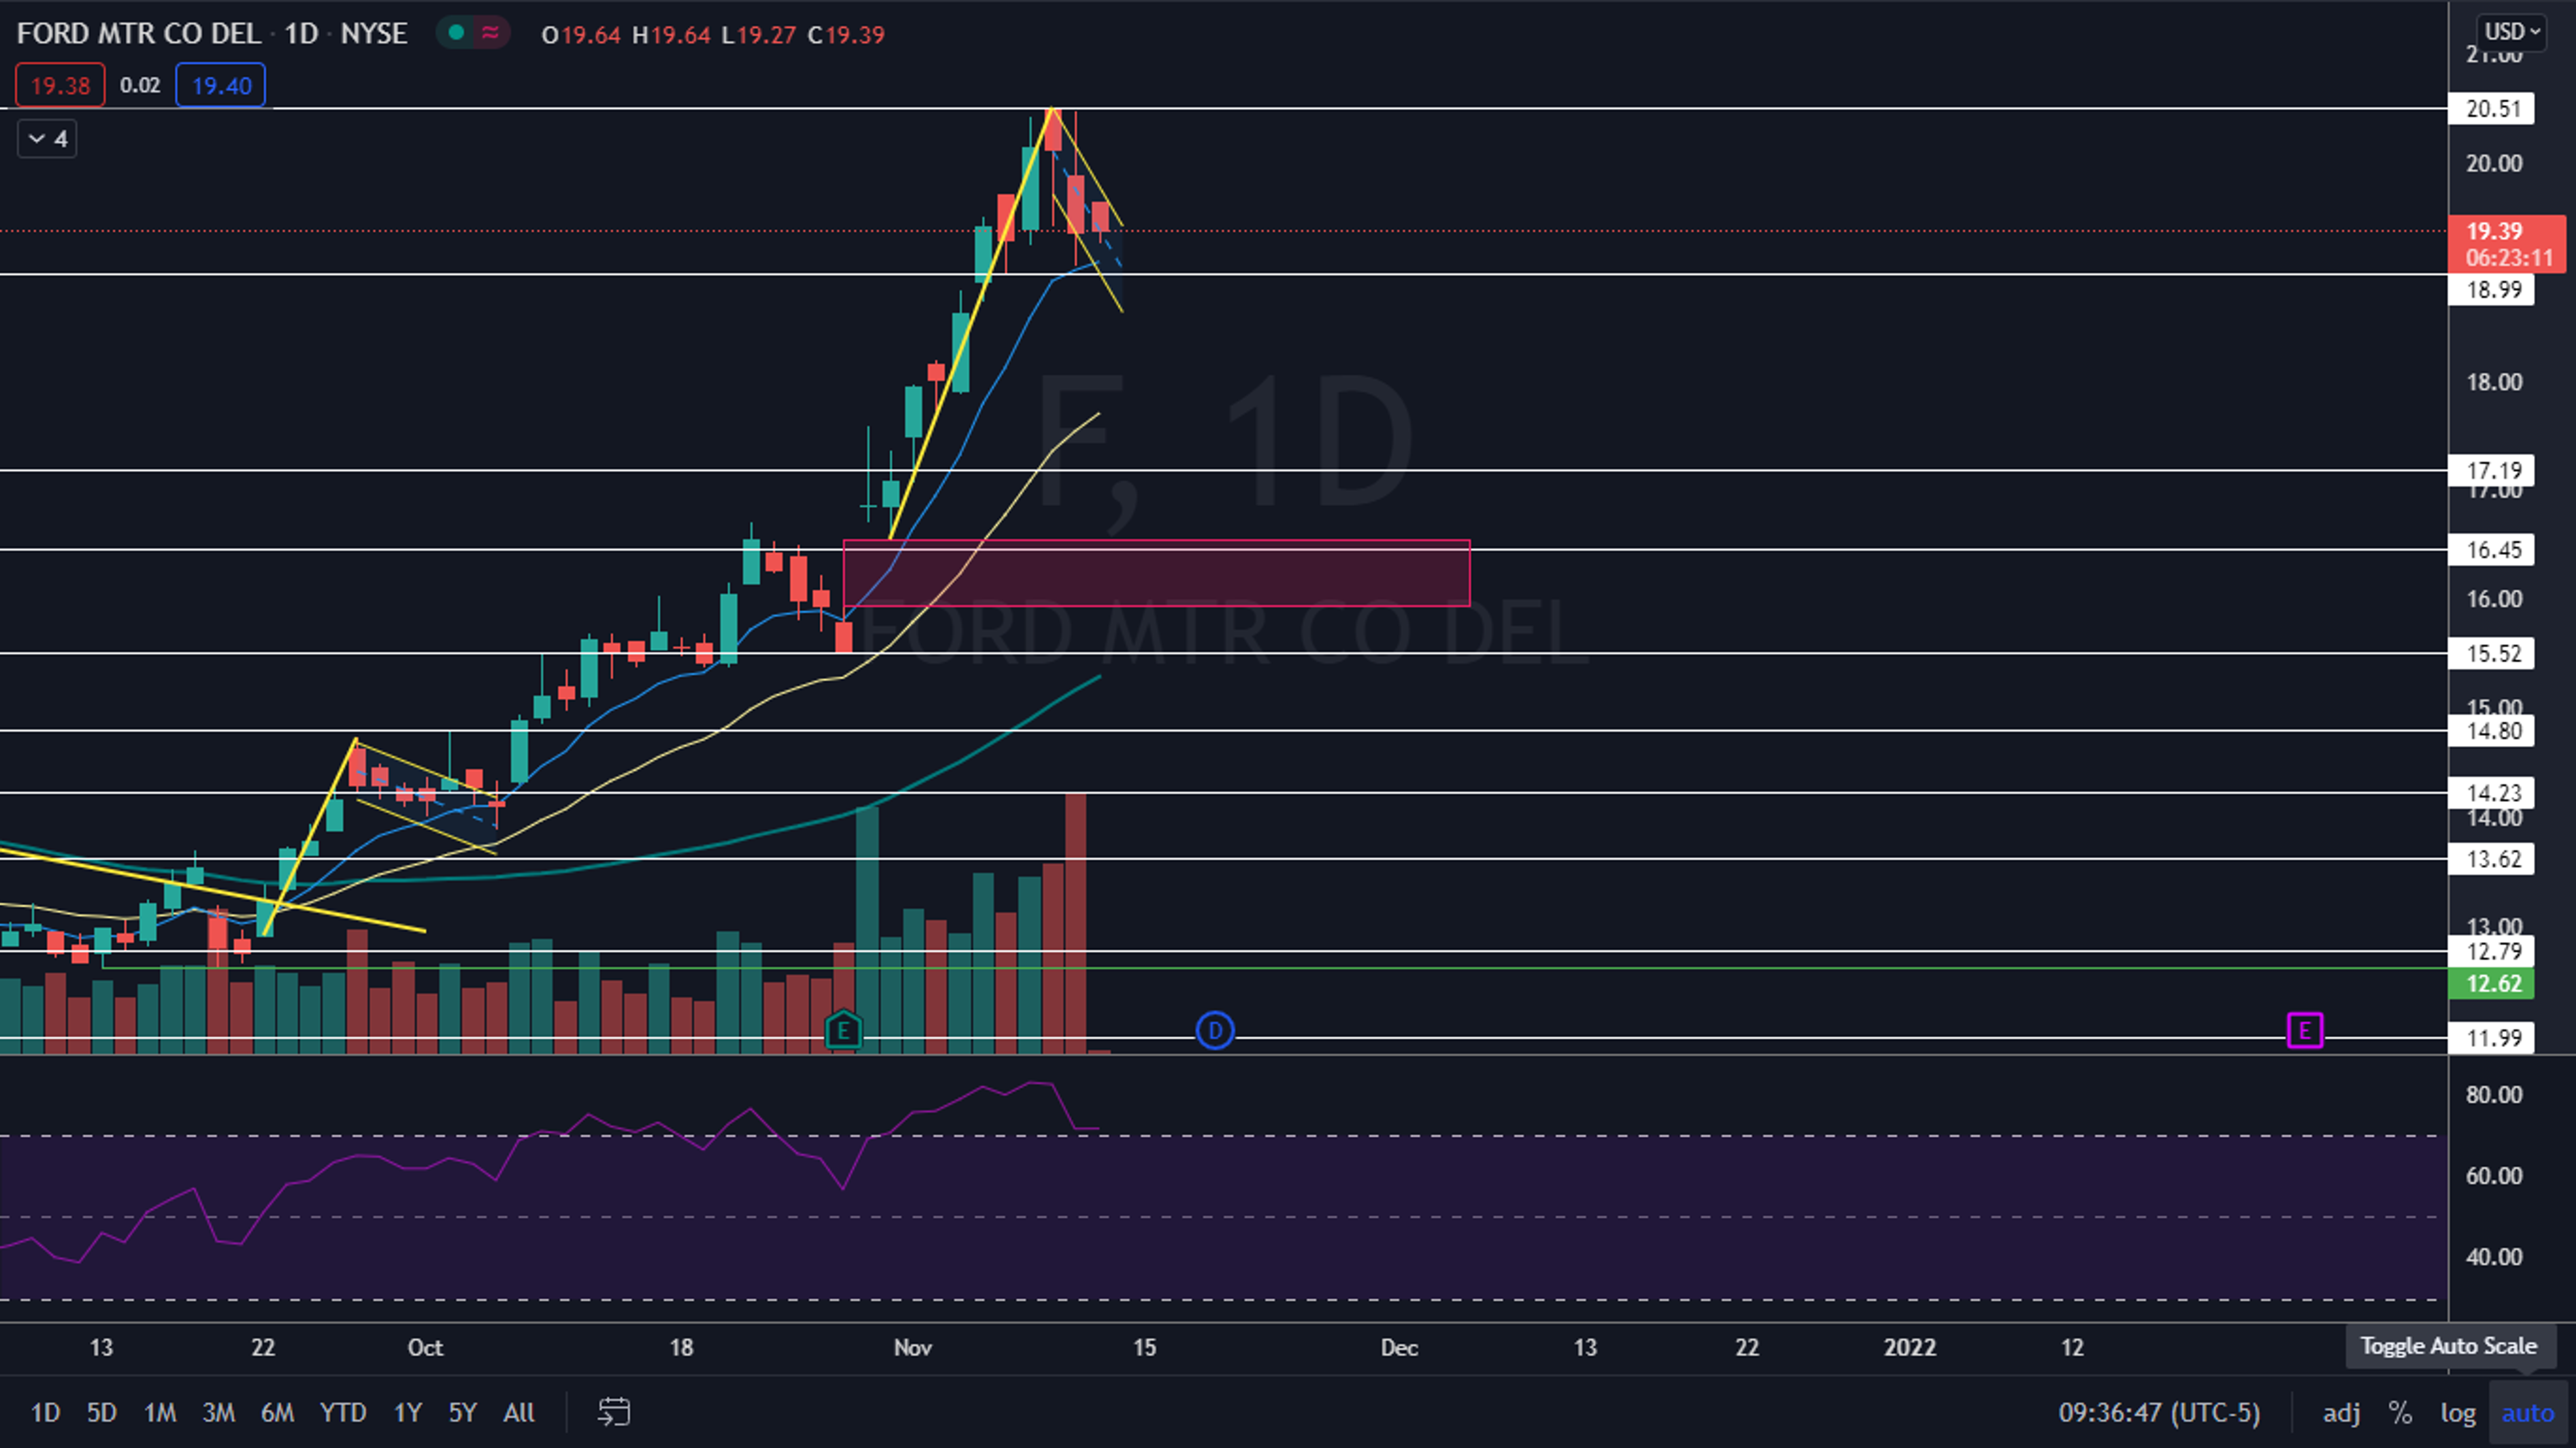
Shares of Ford were cooling off Thursday amid a steep overall market pullback. The stock looks set to charge higher, however, if the bullish pattern on the daily chart plays out.
See Also: How to Buy Ford Stock
The Ford Chart: After trading in a long downtrend between June 4 and Sept. 21, Ford broke up from a descending trendline and reversed course into an uptrend. Since Sept. 22, the stock has made a consistent series of higher highs and higher lows to a high of $20.51, which represents a meteoric 58% rise.
On Wednesday and Thursday, Ford pulled back about 7% from the new high in consolidation. The last leg of the rise, from Oct. 29 to Nov. 9, may be the pole in a bull flag pattern with the consolidation forming the flag. If the bull flag is recognized, the measured move, calculated by measuring the percentage of the pole, is about 23%, which means Ford could eventually reach the $23 level.
The consolidation was also needed to allow Ford to print another lower high, and to cool the stock’s relative strength index (RSI). Ford’s RSI has been running hot above the 70% level since Oct. 28 and when a stocks RSI reaches or exceeds the level it becomes oversold, which can be a sell signal for technical traders.
There is a gap below on Ford’s chart, left behind on Oct. 28 when the stock gapped up following its third-quarter earnings print. Gaps on charts fill about 90% of the time so it is likely Ford will fall down to fill the gap at some point in the future, although it could be quite some time before that happens.
Ford is trading above the eight-day and 21-day exponential moving averages (EMA), with the eight-day EMA trending above the 21-day, both of which are bullish indicators. The stock is also trading well above the 50-day simple moving average, which indicates longer-term sentiment is bullish.
- Bulls want to see the bull flag continue to develop above the eight-day EMA or for an inside bar pattern to develop on Thursday. On a bullish break from either pattern, bulls want to see big bullish volume come in to confirm Ford is heading higher. There is resistance above at $20.51 and $21.69.
- Bears want to see big bearish volume break Ford below the eight-day EMA, which will negate the bull flag. The stock has support below at $18.99 and $17.19.

© 2024 Benzinga.com. Benzinga does not provide investment advice. All rights reserved.
Trade confidently with insights and alerts from analyst ratings, free reports and breaking news that affects the stocks you care about.

