


The following post was written and/or published as a collaboration between Benzinga’s in-house sponsored content team and a financial partner of Benzinga.
EUR/USD Current price: 1.1654
- ECB´s Francois Villeroy repeated that current inflation spikes are expected to be temporary.
- US Treasury yields surged to their highest since mid-May, retreating afterwards.
- EUR/USD is technically bullish but still needs to clear the 1.1670 resistance level.

The EUR/USD pair ticked higher on Wednesday, now trading a few pips below a daily high of 1.1657. The pair is up on the broad dollar’s weakness, with gains limited amid investors finding unattractive the shared currency. European Central Bank policymaker Francois Villeroy repeated that current inflation spikes are expected to be temporary.
The EU released the final version of the September Consumer Price Index, which was confirmed at 3.4% YoY in September, while the core annual reading printed at 1.9%, validating the European Central Bank’s wait-and-see stance. Earlier in the day, Germany published the September Producer Price Index, which rose 2.3% MoM and 14.2% YoY, beating expectations. Also, Bundesbank president Jens Weidmann has announced it will leave is position at the end of the year.
The US calendar has nothing relevant to offer, as the country published Mortgage Applications for the week ended October 15, which printed at -6.3%, much worse than the previous 0.2%. On Thursday, the EU calendar will include the preliminary estimate of October Consumer Confidence, while the US will release Initial Jobless Claims for the week ended October 15, and the October Philadelphia Fed Manufacturing Survey.
EUR/USD short-term technical outlook
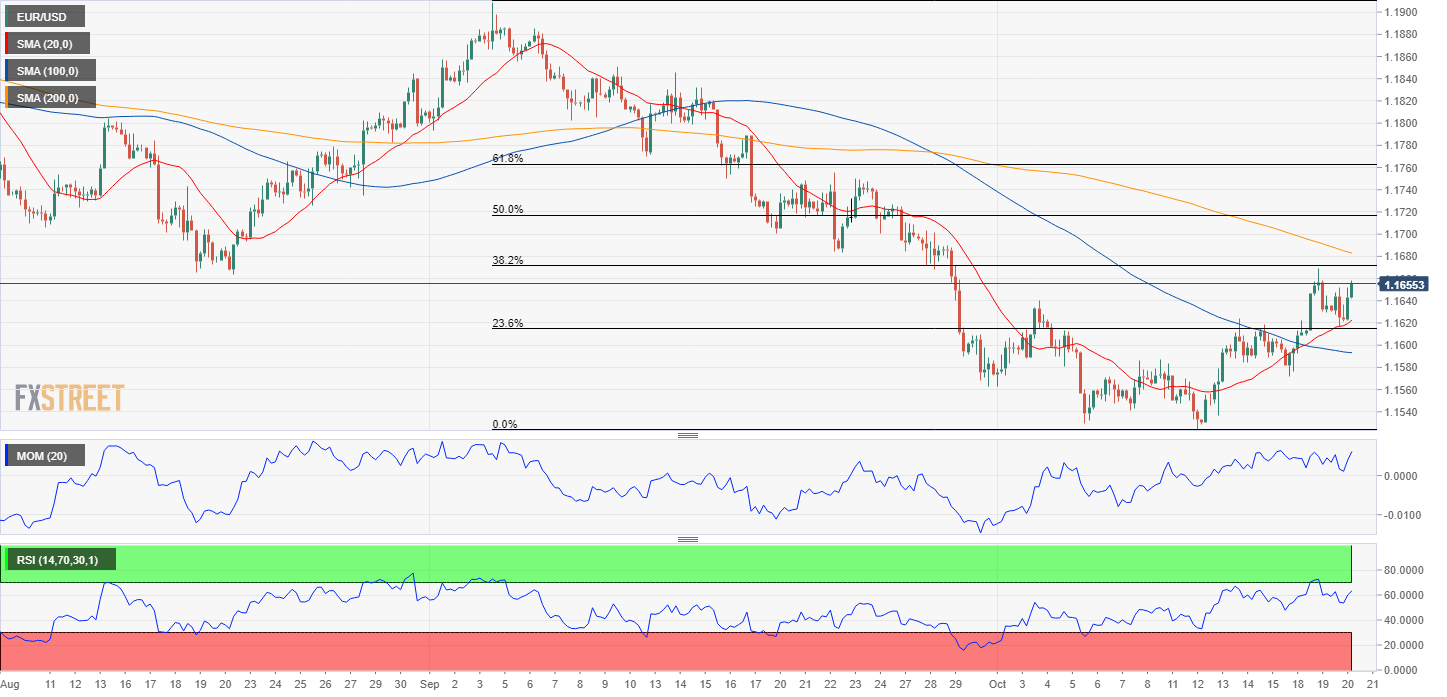
The EUR/USD is trading near its weekly high, confined between Fibonacci levels, but poised to extend its advance. The pair is up for a third consecutive day after consolidating on Friday, although the rally started a week ago, when the pair bottomed at 1.1523. The daily chart shows that the pair continues advancing above its 20 SMA, which converges with a Fibonacci support at 1.1615. The longer moving averages maintain their bearish slopes well above the current level, while technical indicators head firmly higher within positive levels.
In the near term, and according to the 4-hour chart, the pair is bullish, although with limited momentum. It is developing above a bullish 20 SMA, which crossed above the 100 SMA and the 23.6% retracement of its latest daily slump at 1.1615. However, technical indicators are flat to bearish, holding within positive territory but reflecting limited buying interest. The pair needs to advance beyond 1.1670, the weekly high and the 38% retracement to confirm another leg north.
Support levels: 1.1615 1.1570 1.1525
Resistance levels: 1.1670 1.1715 1.1750
Image Sourced from Pixabay
The preceding post was written and/or published as a collaboration between Benzinga’s in-house sponsored content team and a financial partner of Benzinga. Although the piece is not and should not be construed as editorial content, the sponsored content team works to ensure that any and all information contained within is true and accurate to the best of their knowledge and research. This content is for informational purposes only and not intended to be investing advice.
© 2024 Benzinga.com. Benzinga does not provide investment advice. All rights reserved.
Trade confidently with insights and alerts from analyst ratings, free reports and breaking news that affects the stocks you care about.

