


The following post was written and/or published as a collaboration between Benzinga’s in-house sponsored content team and a financial partner of Benzinga.
EUR/USD Current price: 1.1638
- ECB policymakers still diverge on how to handle financial facilities.
- US data missed expectations, but optimism persisted throughout the session.
- EUR/USD has room to extend its advance in the near term after breaching 1.1670 resistance.

The EUR/USD pair retreated from a fresh three-week high of 1.1669 and currently trades in the 1.1640 price zone. Financial markets looked at government bond yields for direction amid a scarce macroeconomic calendar. US yields were down through the first half of the day, weighing on the American currency, jumping to fresh multi-week highs after Wall Street's opening.
The shared currency was affected by comments from European Central Bank chief economist Philip Lane, who said that medium-term inflation pressure are under the ECB's target. However, another European policymaker, Bostjan Vasle, noted there are early signs that wage pressures in the euro area could become material and pose inflation risks, adding that the Pandemic Emergency Purchase Program (PEPP) should be ended in March if "economic trends continue."
The macroeconomic calendar included EU Construction Output, which declined by 1.3% MoM in August after posting a modest 0.1% advance in the previous month. The US published September Housing Starts, down 1.6%, and Building Permits, which fell by 7.7%.
On Wednesday, Germany will publish the September Producer Price Index, while the EU will unveil the final reading of September inflation data. The US calendar has nothing relevant to offer, as the country will only release MBA Mortgage Applications for the week ended October 15.
EUR/USD short-term technical outlook
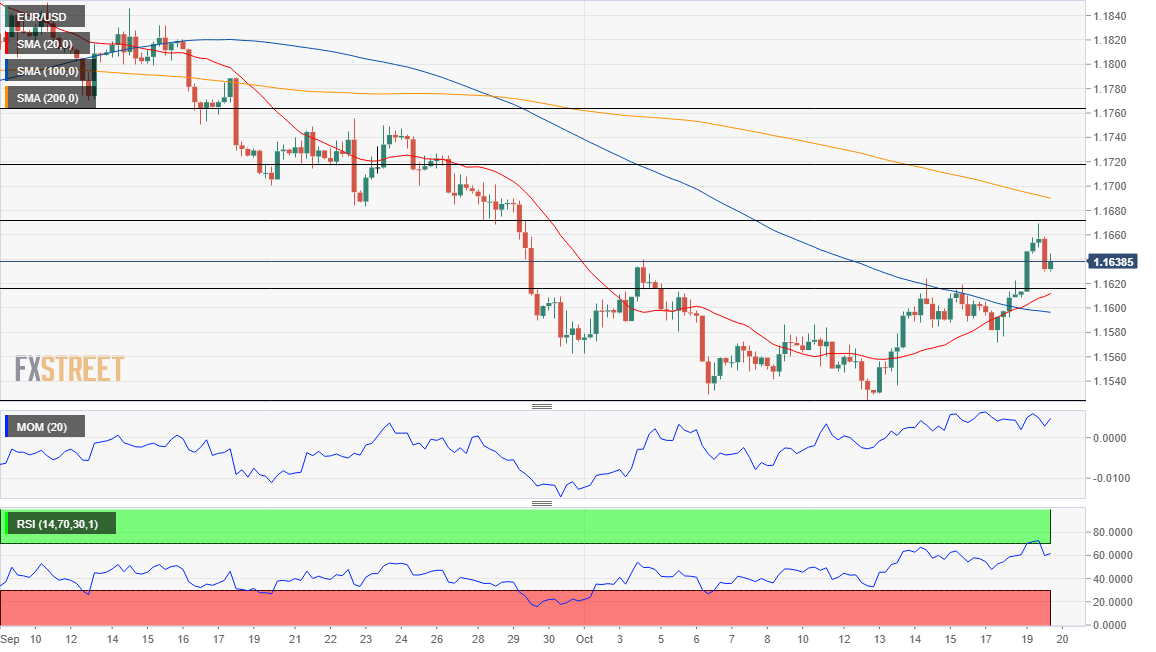
The EUR/USD pair topped at the 38.2% retracement of its latest daily slump at 1.1670, ending a fifth consecutive day with gains. The pair has turned bullish in its daily chart, and further gains could be expected if it breaks the mentioned Fibonacci resistance level. In the mentioned time frame, technical indicators have crossed into positive levels, maintaining their bullish slopes. The pair is also developing above a mildly bearish 20 SMA, which converges with the 23.6% retracement of the same decline at 1.1615.
The pair has room to advance also in the near term, as the 4-hour chart shows that the pair is currently developing above its 20 and 100 SMAs, with the shorter one crossing above, the longer one. Additionally, the Momentum indicator resumed its advance within positive levels while the RSI indicator holds steady at around 61.
Support levels: 1.1615 1.1570 1.1525
Resistance levels: 1.1670 1.1715 1.1750
Image Sourced from Pixabay
The preceding post was written and/or published as a collaboration between Benzinga’s in-house sponsored content team and a financial partner of Benzinga. Although the piece is not and should not be construed as editorial content, the sponsored content team works to ensure that any and all information contained within is true and accurate to the best of their knowledge and research. This content is for informational purposes only and not intended to be investing advice.
© 2024 Benzinga.com. Benzinga does not provide investment advice. All rights reserved.
Trade confidently with insights and alerts from analyst ratings, free reports and breaking news that affects the stocks you care about.

