


On Thursday evening, Benzinga asked its followers on Twitter what they’re buying at the open on Friday. From the replies, Benzinga selected one ticker for technical analysis. @Alex95027627, @BenE3757, @eljefetrades, @soxfan020, @coryethomas, @RenauSnchal, @LordDanVal and @GodarmyofAngel are buying AMC Entertainment Holdings, Inc AMC.
Ahead of the opening weekend of the 25th James Bond movie “No Time To Die,” AMC CEO Adam Aron took to Twitter to write that while detractors have been playing checkers, he feels AMC has been playing three-dimensional chess: “To the naysayers, I say it loud: CHOKEonTHAT,” he finished.
AMC has fans who range from moviegoers who enjoy films to apes who like the stock. While both groups seem to enjoy their fair share of drama, the latter remain laser-focused on lack of full market transparency, naked shorting, dark pools trading and the stock's underlying statistics.
Short interest data is currently updated just twice per month. As per the most current data, AMC has a total float of 511.47 million with 97.13 million shares, meaning 18.99%, held short. The number has increased from 92.42 million in August.
See Also: Can 'No Time To Die' Set A James Bond Box Office Record?
The AMC Chart: On Sept. 28, AMC broke down from a pennant pattern the stock had been trading in since June 2. The bearish break from the pattern was made on low volume, however, and lack of bearish follow-through has resulted in the stock trading sideways.
The sideways trading pattern has created a second lower trendline that, when drawn up from the price action on May 6, may create a slightly larger pennant pattern. There may also be a second smaller pennant pattern developing inside the larger pattern because the trading range of AMC has been tightening since Sept. 30.
Since Aug. 24 AMC’s daily volume has been decreasing. When volume decreases it indicates a lack of both buyers and sellers of a stock, however, decreasing volume is often followed by a big burst of volume. Traders can watch big volume come in when AMC breaks from the smaller pennant pattern to judge whether the formation was recognized.
AMC is trading below the eight-day and 21-day exponential moving averages (EMAs), with the eight-day EMA trending below the 21-day, both of which are bearish indicators. The stock is trading well above the 200-day simple moving average, however, which is bullish.
- Bulls want to see big bullish volume come in to break AMC up from the smaller pennant pattern, or for the stock to continue to trend slightly up into the larger pennant. AMC has resistance above at $39.07 and $43.33.
- Bears want to see AMC break down bearishly from the pennant on big bearish volume. The stock has support below at $35.59 and $31.81.

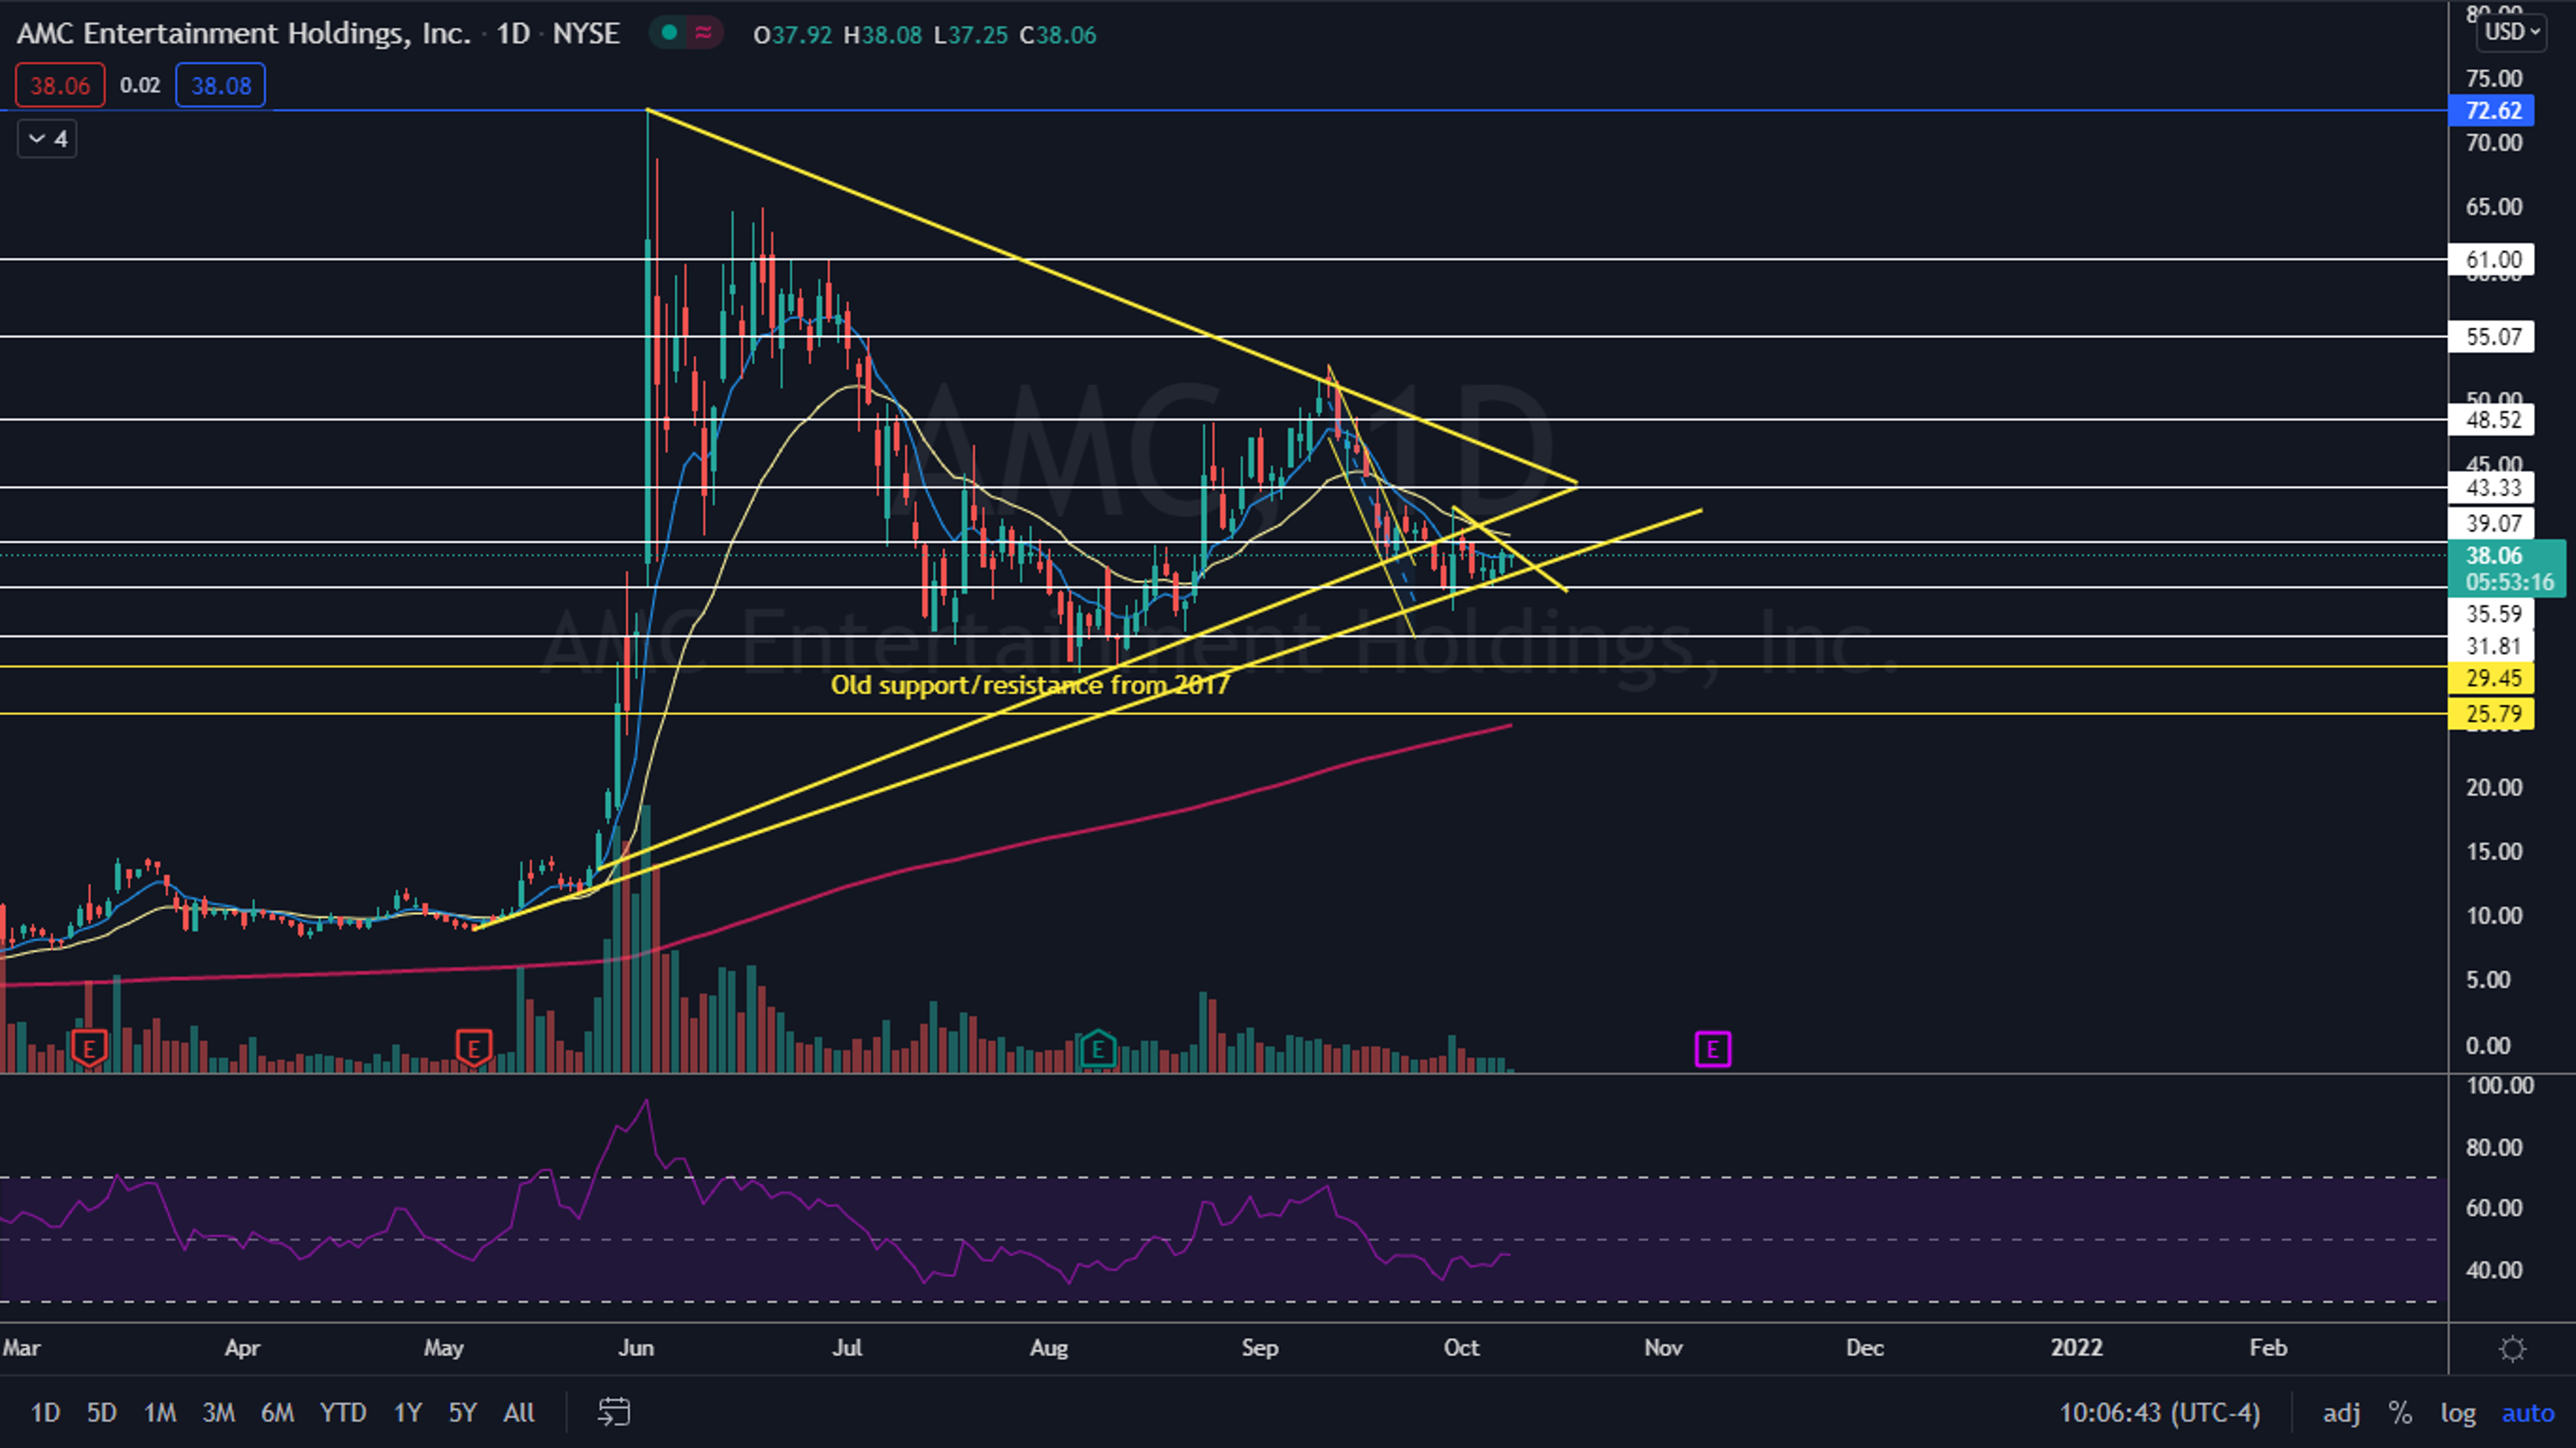
Photo: Pavel Danilyuk from Pexels
© 2024 Benzinga.com. Benzinga does not provide investment advice. All rights reserved.
Trade confidently with insights and alerts from analyst ratings, free reports and breaking news that affects the stocks you care about.

