


The following post was written and/or published as a collaboration between Benzinga’s in-house sponsored content team and a financial partner of Benzinga.
GBP/USD Current price: 1.3836
- The UK will publish Industrial Production and growth-related data on Friday.
- Weakening US government bond yields sent the dollar lower across the board.
- GBP/USD holds on to intraday gains near its weekly highs, could test 1.3900.

The GBP/USD pair touched 1.3862 on Thursday, nearing its weekly high at 1.3867 on the back of the prevalent dollar’s weakness. The pound was among the best performers, helped by the absence of news coming from the United Kingdom. On the contrary, the UD was the worst performer on the back of falling US government bond yields. The yield on the 10-year Treasury note fell to 1.287%, piercing the 1.30% critical threshold after a disappointing 30-year note auction.
At the beginning of the day, the UK released the RICS Housing Price Balance, which came in at 73%, below the 75% expected and contracting from the previous 79%. The kingdom’s calendar will be quite busy on Friday, as the country will release July Industrial Production and Trade Balance and the monthly Gross Domestic Product. The latter is expected at 0.6%, down from the previous 1%.
On the coronavirus front, the UK reported 38,013 new cases, slightly below those reported on Wednesday, while the death toll was 167. On a positive note, the number of positive tests has declined 4% from a week earlier.
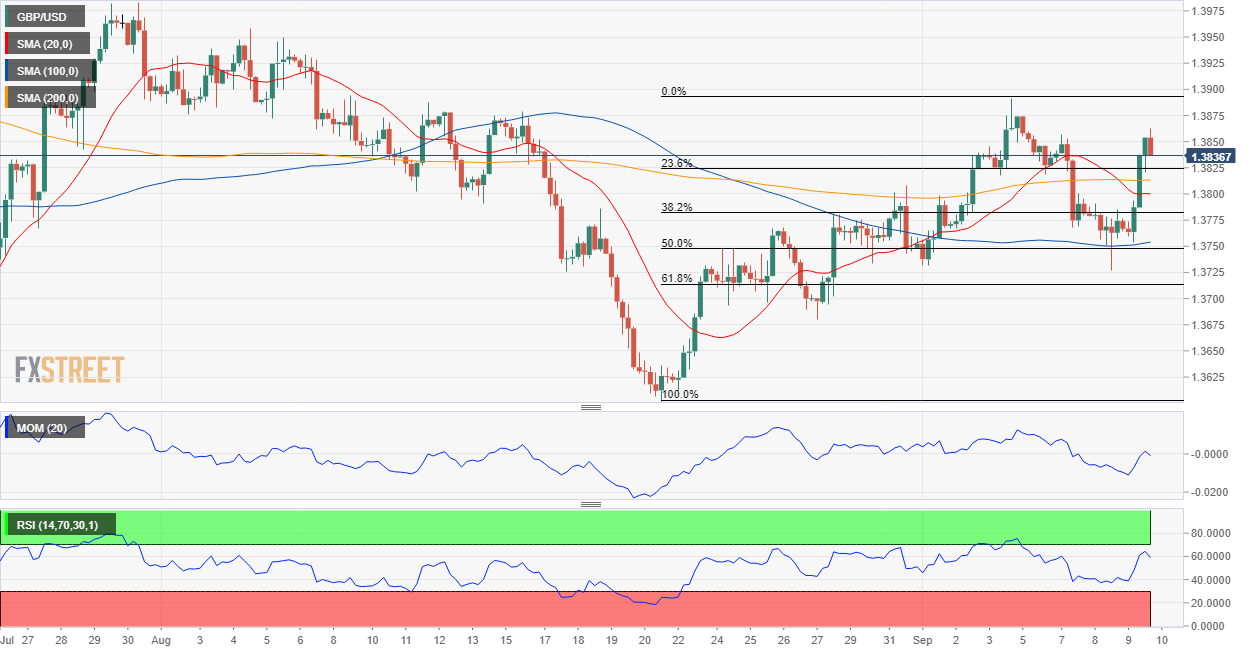
GBP/USD short-term technical outlook
The GBP/USD pair trades around 1.3840, retaining most of its intraday gains. The daily chart shows that it has met buyers around its 20 SMA, while currently above a mildly bullish 200 SMA. Technical indicators head firmly higher, with the Momentum at fresh one-month highs, somehow suggesting further gains ahead.
The 4-hour chart shows that the pair is developing above all of its moving averages, while the Momentum indicator maintains its bullish slope within positive levels, However, the RSI indicator is easing from intraday highs, somehow suggesting a possible near term slide, with an immediate Fibonacci support level at 1.3820.
Support levels: 1.3820 1.3790 1.3745
Resistance levels: 1.3890 1.3930 1.3985
Image by Thanks for your Like • donations welcome from Pixabay
The preceding post was written and/or published as a collaboration between Benzinga’s in-house sponsored content team and a financial partner of Benzinga. Although the piece is not and should not be construed as editorial content, the sponsored content team works to ensure that any and all information contained within is true and accurate to the best of their knowledge and research. This content is for informational purposes only and not intended to be investing advice.
© 2024 Benzinga.com. Benzinga does not provide investment advice. All rights reserved.
Trade confidently with insights and alerts from analyst ratings, free reports and breaking news that affects the stocks you care about.

