


EUR/USD Current Price: 1.0906
- The spread of coronavirus is painfully slowing, pandemic far from over.
- The ECB announced a package of temporary collateral easing measures.
- EUR/USD with its bullish potential limited, advancing only because of dollar’s weakness.

The EUR/USD pair traded as high as 1.0926 this Tuesday, as the positive momentum of global equities weighed on the dollar’s demand. The American currency partially recovered its charm into London’s fix but edged lower for the day against most of its major rivals. Given that data release in the last sessions was pre-crisis, it passed unnoticed. More relevant, the ECB announced a package of temporary collateral easing measures to facilitate the availability of eligible collateral for Eurosystem counter-parties to participate in liquidity providing operations. Pretty much, the ECB decided to accept any EU government bond as collateral, included those of troubled countries such as Italy or Greece.
Market players remained cautiously optimistic, with global equities posting substantial gains and government bond yields rising, amid hopes the coronavirus pandemic has started to slow. Nevertheless, the situation is still rough. Italy reported a slower pace of new cases and death toll, although this last rose in Spain. The number of cases in the US is at roughly 370K. That said, chances of re-opening economies in the foreseeable future are quite a few.
The macroeconomic calendar will remain scarce this Wednesday, with no data scheduled in the EU. The most relevant event would be the release of the FOMC Meeting Minutes
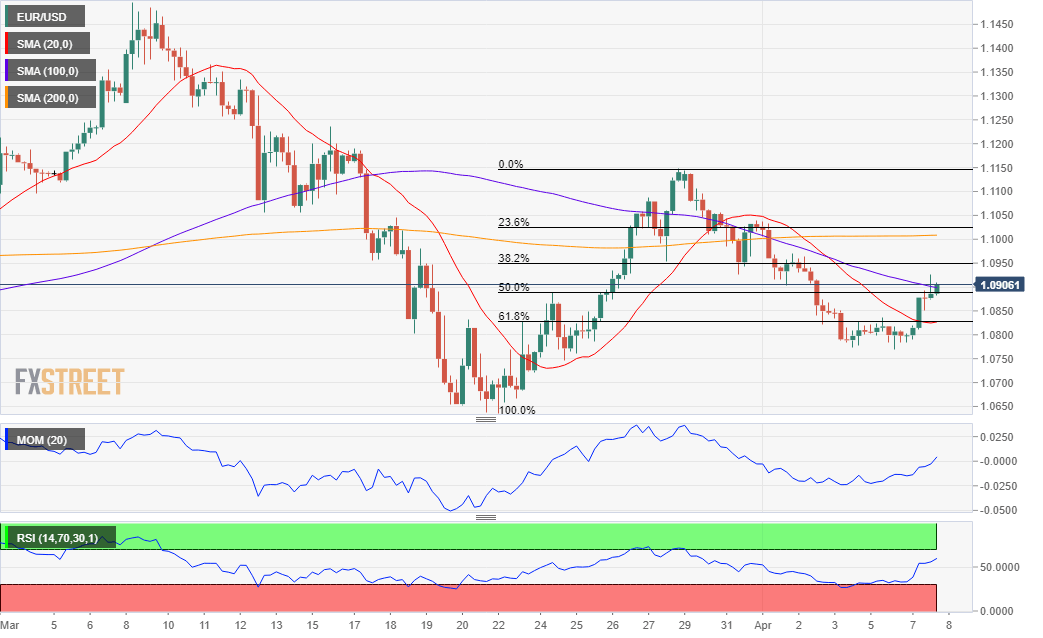
EUR/USD Short-Term Technical Outlook
The EUR/USD pair is holding above the 50% retracement of its latest daily advance at 1.0890, the immediate support. The 4-hour chart shows that the pair is comfortable above the 61.8% retracement of the same rally at 1.0830, with the 20 SMA converging with it. The same chart shows that the pair was unable to settle above a mild-bearish 100 SMA, although it keeps hovering around it. Technical indicators hold at their monthly highs but are losing their strength upwards, indicating limited bullish strength.
Support levels: 1.0890 1.0860 1.0830
Resistance levels: 1.0915 1.0950 1.0990
Image source from Pixabay
© 2024 Benzinga.com. Benzinga does not provide investment advice. All rights reserved.
Trade confidently with insights and alerts from analyst ratings, free reports and breaking news that affects the stocks you care about.

