Report & Data Research and Analysis by Shrey Devulapalli


Results of COVID-19 on Small Business Marketing
As we have all experienced firsthand, the COVID-19 pandemic has resulted in millions of jobs lost, loved ones taken from our homes and a level of economic volatility that has rarely been experienced. However, today, more than a year after the first U.S. case, the country is slowly emerging from mask mandates, businesses are gradually opening their doors back up and vaccine administration is expanding across the globe everyday. Things are beginning to feel back to “normal.” In many areas, though, there’s a new normal. For instance, in the business world, the pandemic caused technology and digital transformation to accelerate by 6 years in a matter of months. One facet of business that faced the most chaos and uncertainty has been marketing.
Apple (NASDAQ: AAPL), Microsoft (NASDAQ: MSFT), Amazon (NASDAQ: AMZN). These companies are expected to be ready for the metamorphosis of technology that has arisen from COVID-19, with cash on hand and marketing teams that are the best of the best — ready for anything. That’s not the case for all businesses though — especially small businesses.
Read this edition of Benzinga Reports for an in-depth look at how the COVID-19 pandemic impacted marketing efforts by small businesses in an array of industries as well as across 4 primary economic sectors. Industries include consumer goods, consumer services, financial/banking, education, energy, healthcare, manufacturing, mining, consulting, retail, tech and transportation. We also analyze the difference in marketing spend based on revenue versus budget for business-to-business and business-to-consumer product and service sectors and whether one aspect of marketing is prioritized to a larger extent than another to see why certain industries saw varying levels of change in small businesses as compared to public companies.
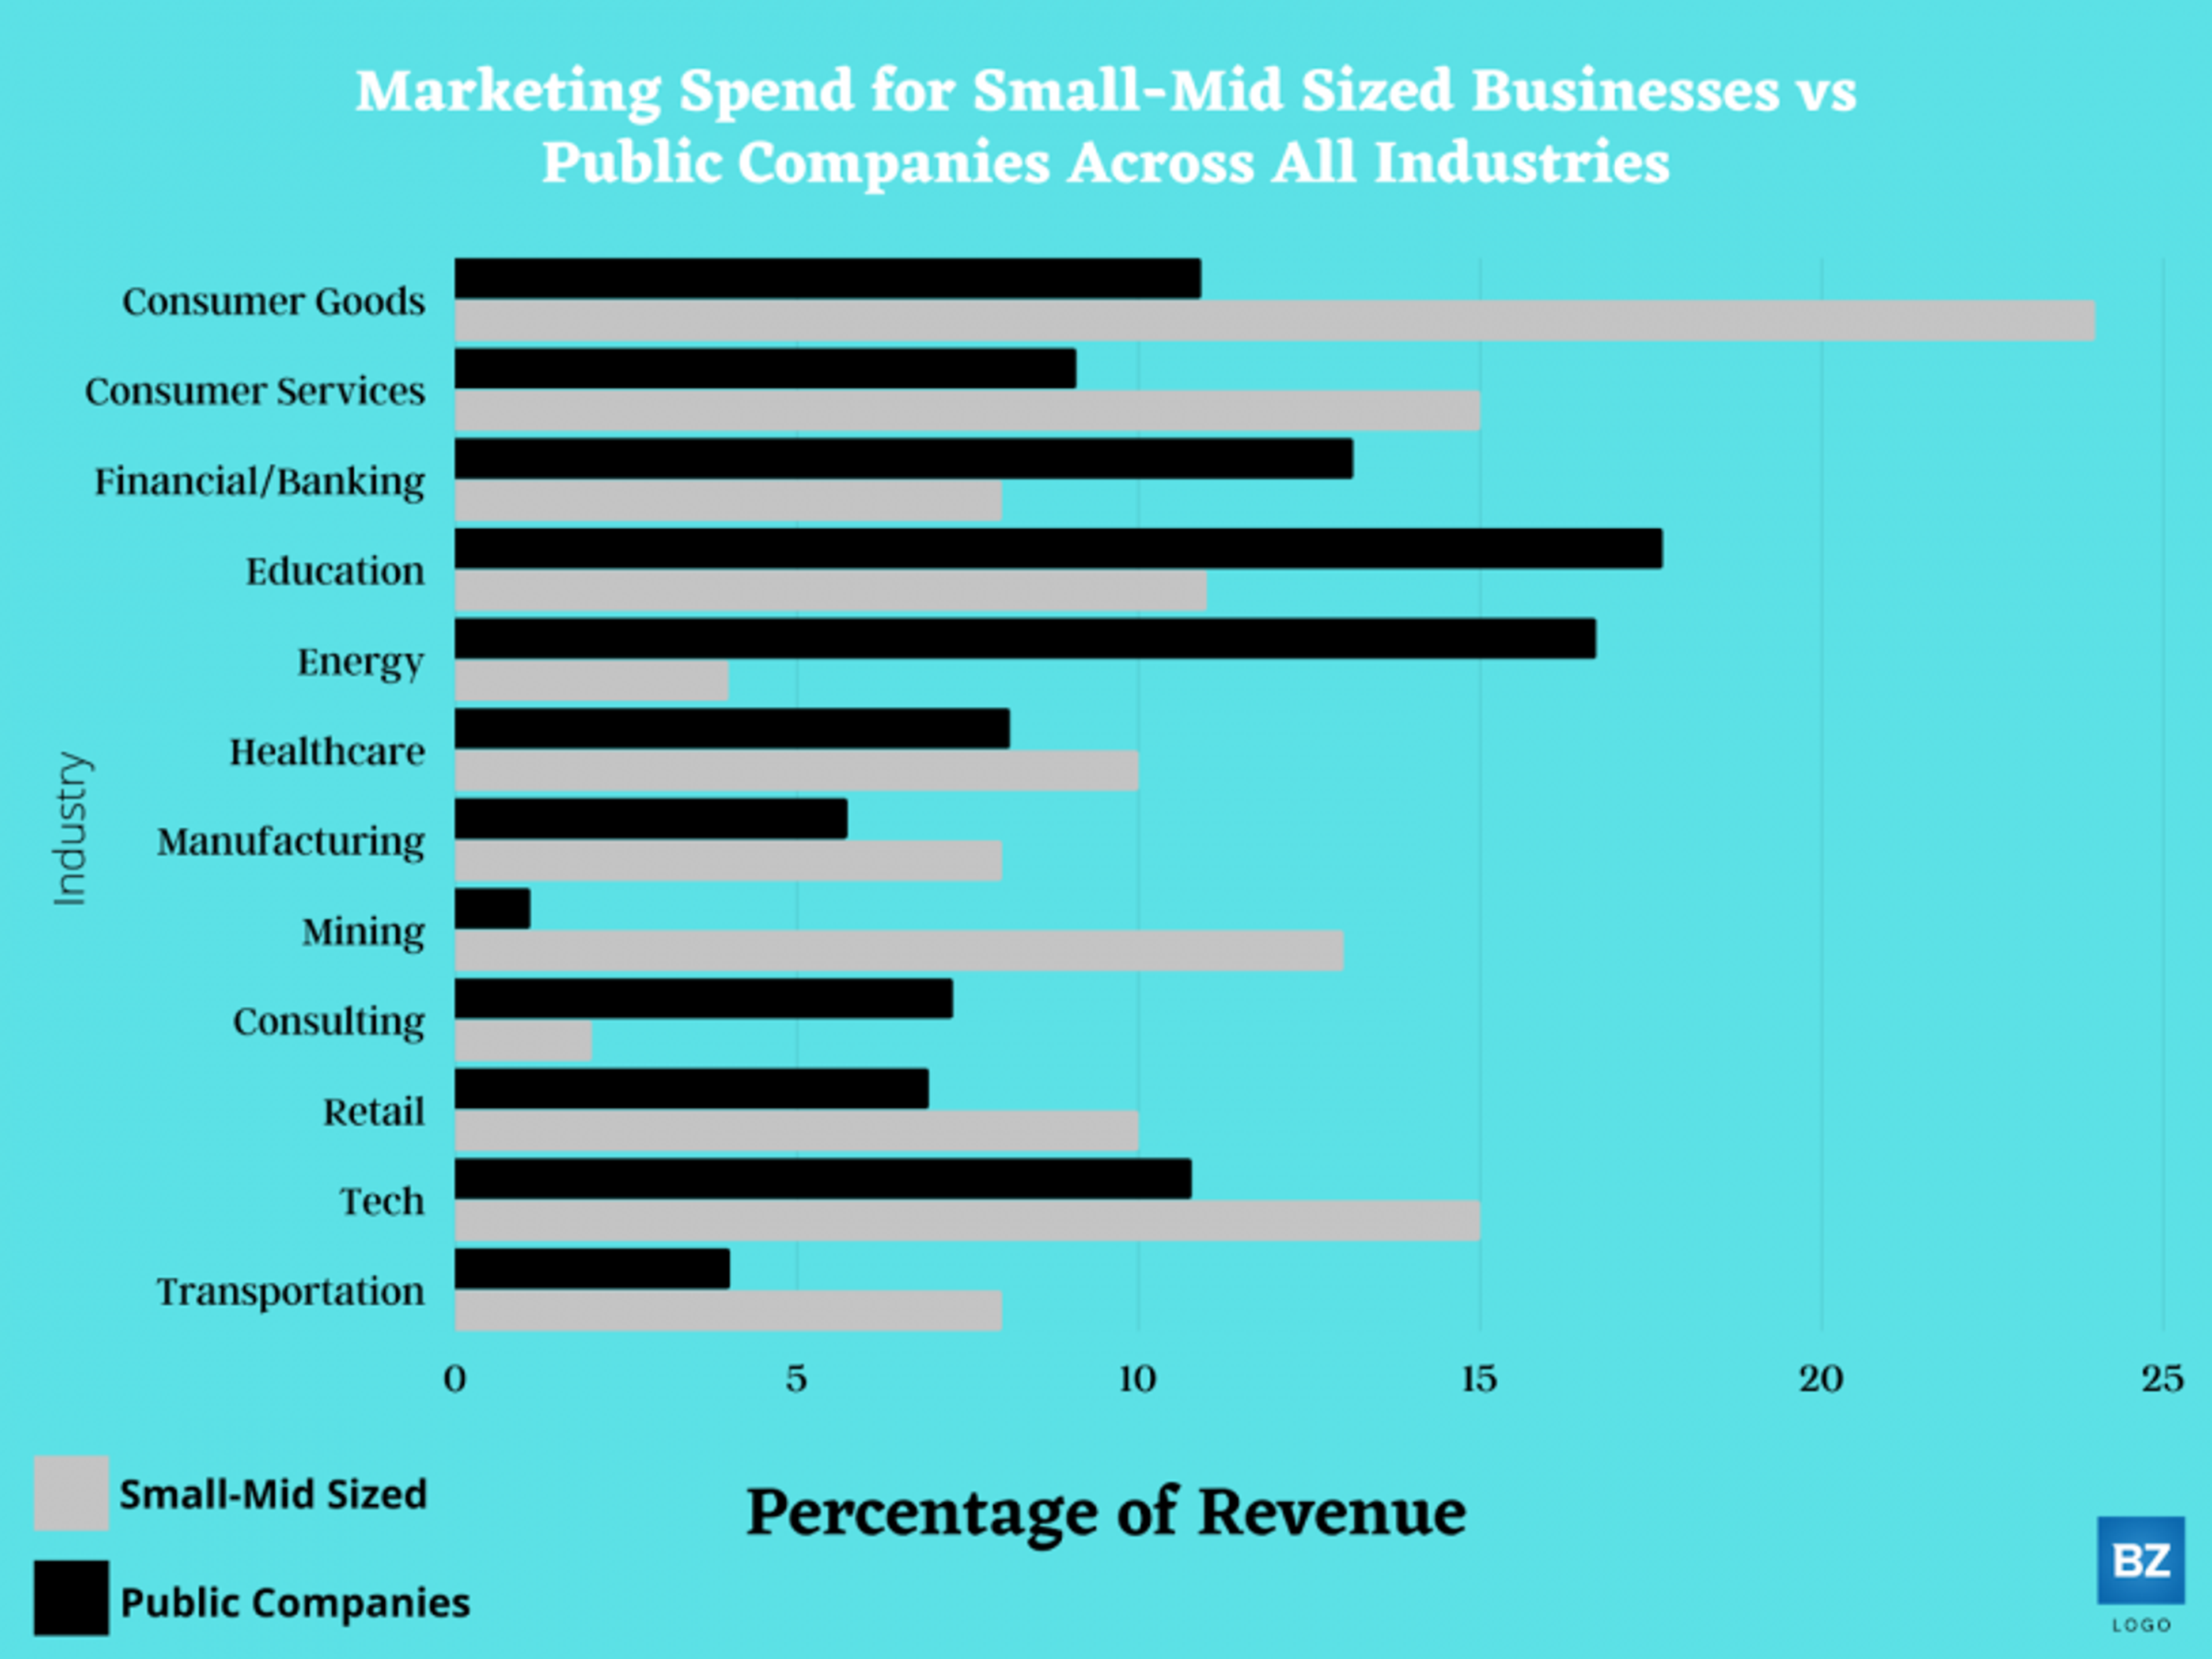
Key Points: Marketing Spend and Profit Levels of Small Biz Industries
- Industries with above-average marketing spend for small-to-mid sized businesses and below-average marketing spend for public companies: 3/12 (Finance, Education, Energy).
- Industries with below-average marketing spend for small-to-mid sized businesses and above-average marketing spend for public companies: 2/12 (Mining, consumer services).
- 5 industries have above-average marketing spend for small-mid sized businesses.
- 7 industries have below-average marketing spend for small-mid sized businesses.
- 5 industries have above-average (or average) marketing spend for public companies
- 7 industries have below-average marketing spend for public companies.
- Out of the 5 industries with above-average marketing spend for small businesses, 2 industries have above-average marketing spend for public companies, too.
- Out of the 7 industries with below-average marketing spend for small businesses, 5 industries have above-average marketing spend for public companies, too.
- As of Feb 2021, small businesses across all industries decreased traditional advertising spending by 0.2% on average.
- As of Feb 2021, small businesses increased digital marketing spending by 9.5% on average.
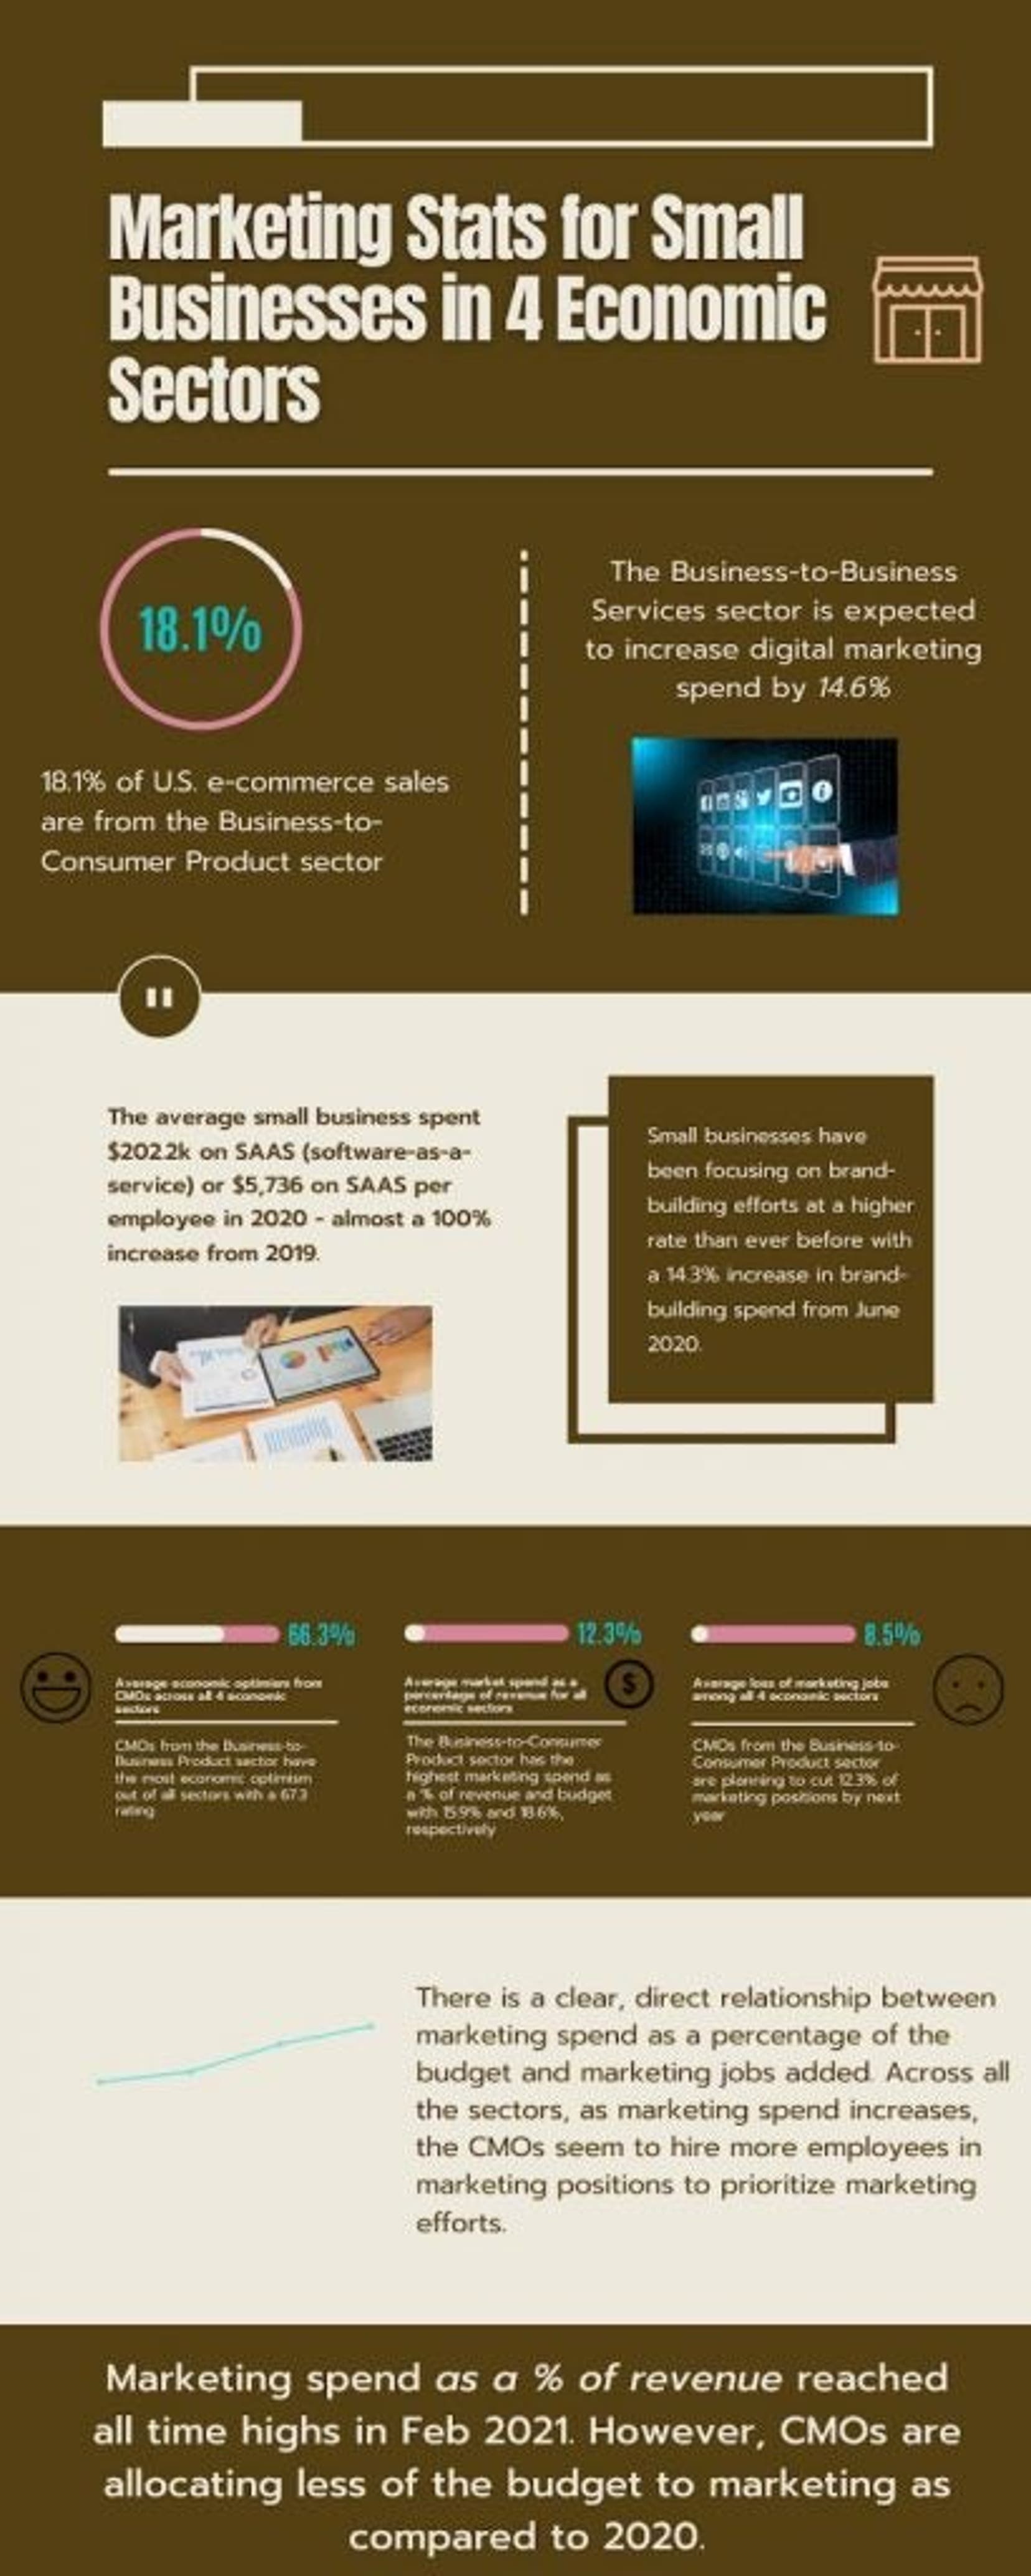
- As of Feb 2021, small businesses increased spending on brand-building by 14.3%.
- Over the past decade, the average marketing spend as a percentage of revenue is 9.06%.
- This number was at its highest in Feb 2021 at 13.2%.
- Over the past decade, the average marketing spend as a percentage of budget is 10.91%.
- This number was at its highest in June 2020 at 12.6%.
- In the past 7 years:
- average change in traditional advertising spend is -1.47%.
- average change in digital marketing spend is 6.84%.
- average change in brand-building spend is 12.86%.

Diving Deeper: Marketing Spend and Trends of Economic Sectors
- Sectors: Business-to-Business (B2B) Products, B2B Services, Business-to-Consumer (B2C) Products, B2C Services
- Average marketing as a percentage of revenue across sectors: 12.23%
- Average marketing as a percentage of budget across sectors: 14%
- Average economic optimism from CMOs: 66.25 points
- Average net job change for marketing positions: 0.85%
- B2C Product sector is leader of U.S. e-commerce sales: 18.1%
- Sectors with above-average economic optimism have below-average net job change and sectors with below-average economic optimism have above-average net job change

Notable Sector-by-Sector Findings: Marketing spend, economic optimism and marketing jobs change:
- As % of rev, the B2B Product sector has the lowest marketing spend of all sectors: 9.40%.
- As % of rev, the B2C Product sector has the highest marketing spend of all sectors: 15.9%.
- As % of budget, the B2B Product sector also has the lowest marketing spend of all sectors: 10%.
- As % of budget, the B2C Product sector also has the highest marketing spend of all sectors: 18.6%.
- CMOs from the B2B Product sector have the highest economic optimism: 67.3 points.
- CMOs from the B2B Service sector have the lowest economic optimism: 65.6 points.
- B2C Product sector has the highest net job change (marketing): 5.41%.
- B2C Services sector has the lowest net job change (marketing): -3.8%.
- The B2B Services sector has the highest change in digital marketing spend: 14.62%.
- The B2C Services sector has the lowest change in digital marketing spend: 9.3%.
Methodology
To analyze a possible correlation between marketing efforts in small businesses, public companies and various sectors, we examined the change in marketing spend and optimism for all of these entities. We did the same for :
Economic sectors:
Industries:
SaaS Spend:
- Source: Information Age