Several ways to trade forex using technical analysis exist. A popular strategy involves looking for classic patterns on exchange rate charts. The head and shoulders pattern falls among the more reliable and popular reversal chart patterns, and it generally occurs when a trend is about to change direction. The head and shoulders pattern also benefits traders by providing clear trading signals and measuring objectives that make developing a trading strategy based on it very easy.

What is Forex?
A foreign exchange (forex for short) transaction involves exchanging 1 national currency for another in a currency pair. Currencies trade actively relative to each other in the huge forex market that had an average daily trading volume of $6.6 billion in April 2019, according to the Bank for International Settlements (BIS).
Each forex transaction involves 2 currencies that are exchanged at an agreed-upon rate of exchange or exchange rate. The 1st currency that appears in a currency pair is known as the base currency while the 2nd currency is the counter or quote currency in the pair.
Every national currency has been assigned a 3-letter code by the International Organization for Standardization (ISO). Common notation for a currency pair in the forex market consists of the ISO codes for the base currency and the counter currency separated by a slash.
An example of a currency pair would be the European Union’s euro with the ISO code EUR quoted against the U.S. dollar that has the ISO code USD. The shorthand for this pair in the forex market is generally written EUR/USD.
What is the Head and Shoulders Pattern in Forex Trading?
Many forex traders who base their trading decisions on technical analysis use classic chart patterns to decide when to get into or out of the market. Such patterns are thought to arise because of mass psychology acting in the marketplace and then being reflected in the exchange rates of currency pairs.
The main advantage of using chart patterns is that they allow traders to set entry points, take-profit goals and stop-loss levels that can be placed in the forex market as orders. Studying charts can help you plan a forex trade in advance and enter all its necessary entry and exit orders at one time.
The head and shoulders pattern is 1 of the most popular and reliable classic chart patterns that technical traders commonly use. It is generally considered a reversal pattern because it typically appears when the market is about to change direction after a significant upward or downward trend.
This pattern has 2 forms that provide either a bullish or bearish trading signal as follows:
- Bullish: The bullish head and shoulders bottom chart pattern has 3 troughs where the central low point or head is the lowest, while the other 2 shoulders fall to roughly equal levels. This pattern appears when the market is set for a rally once the neckline drawn between the high points on either side of the head trough is breached to the upside. The market is then expected to rise in an amount roughly equal to the distance between the head’s low and the highs to either side of it. A schematic of this chart pattern and its measuring objective are shown in the image below.

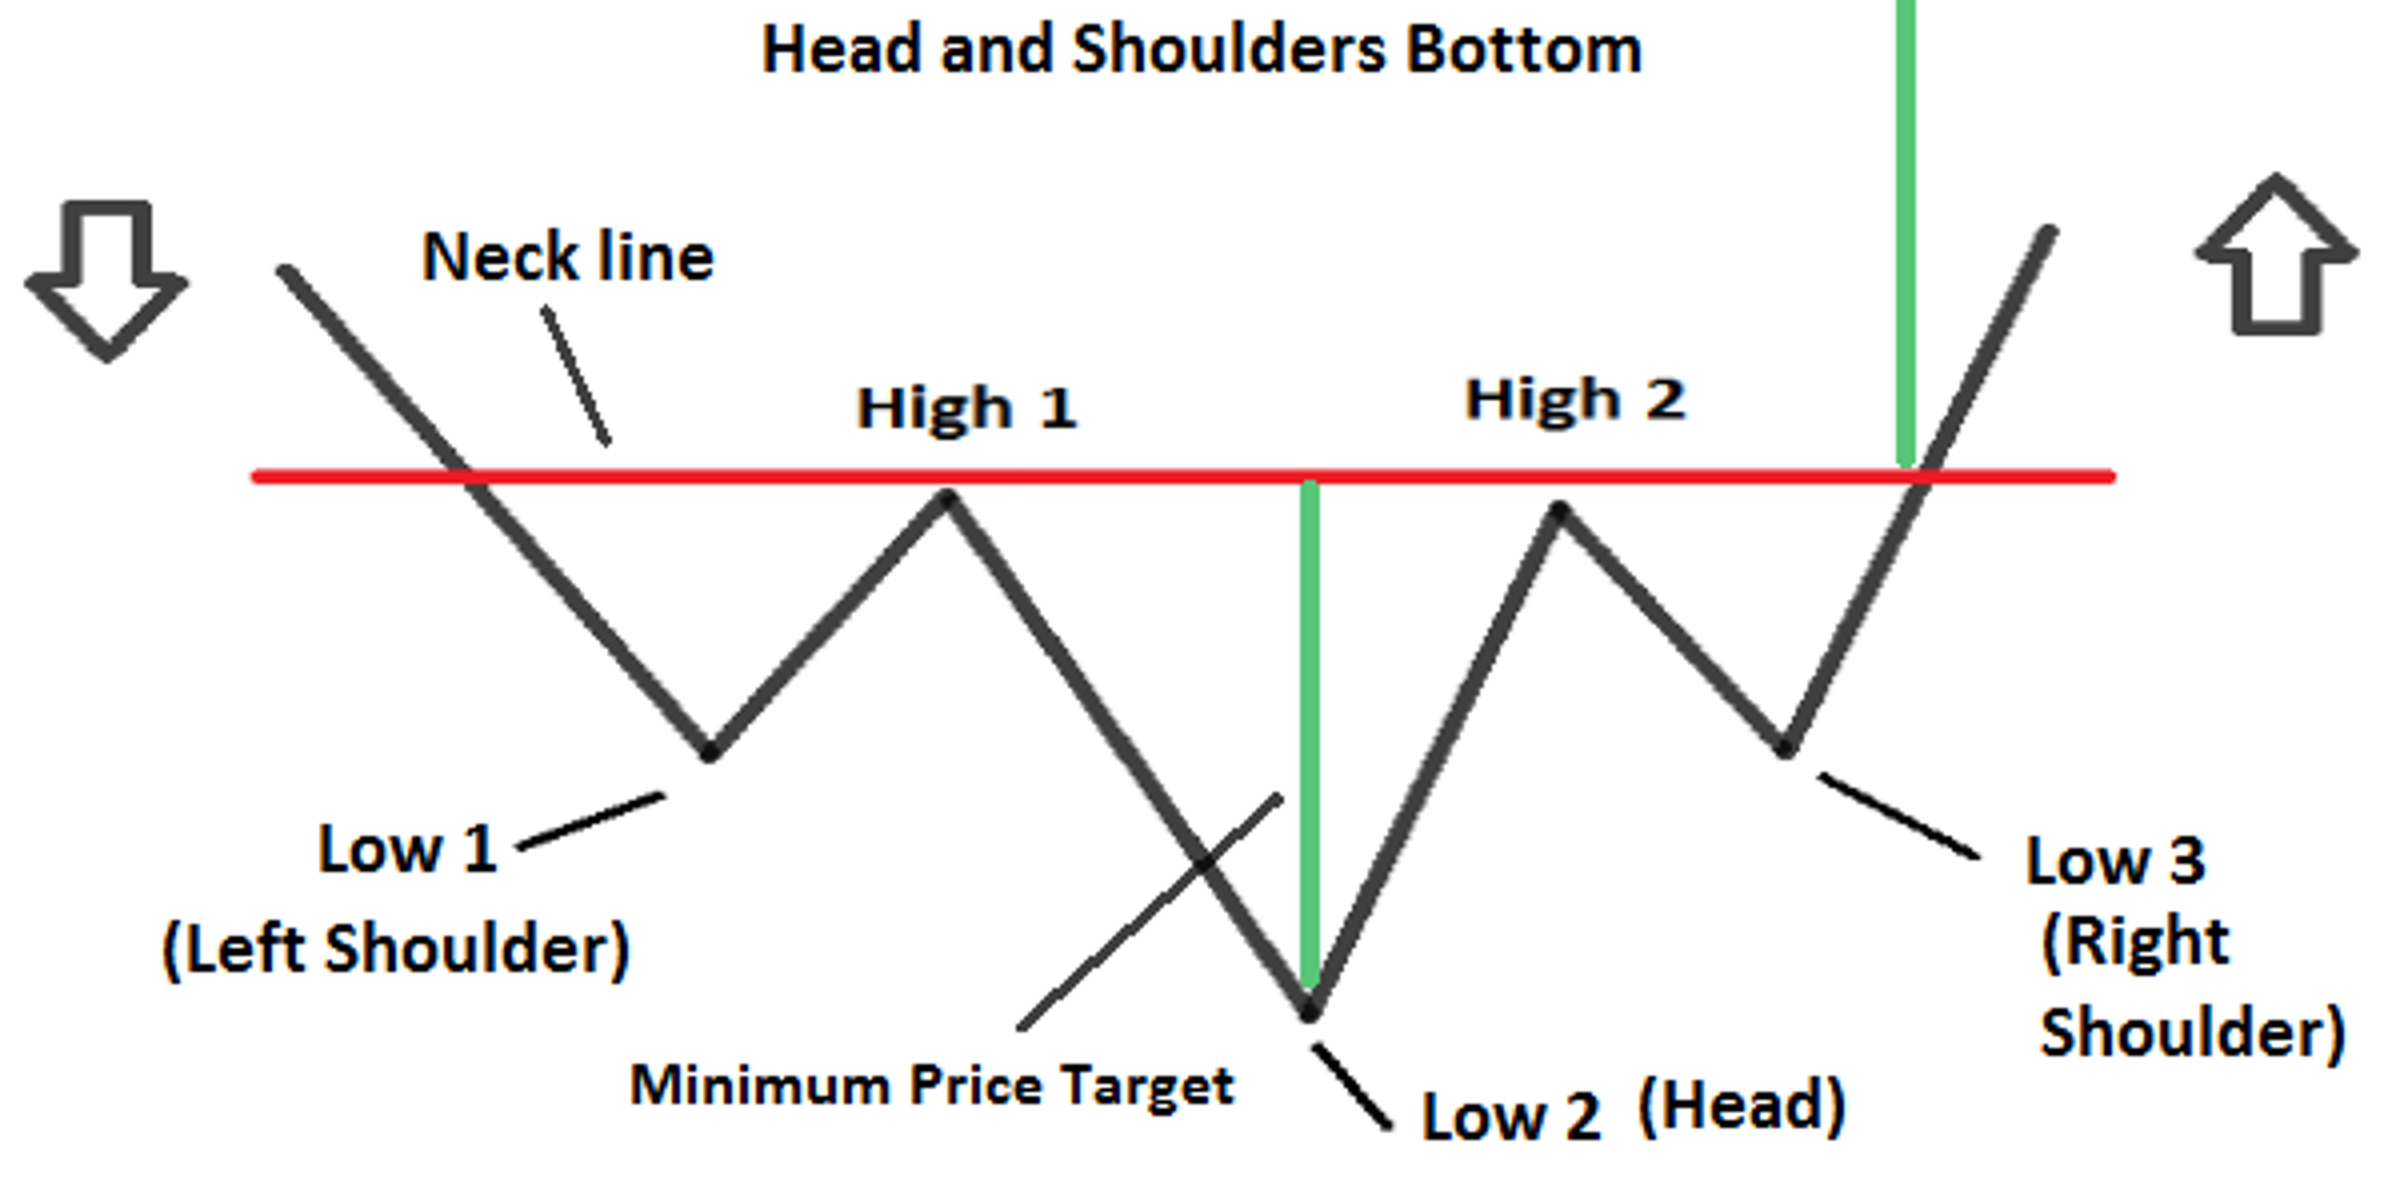
Schematic of a bullish head and shoulders bottom pattern. Source: Feedroll.
- Bearish: The bearish head and shoulders top chart pattern has 3 peaks where the central peak or head is higher than the 2 shoulders to either side. This pattern suggests that a reversal to the downside is imminent once the line drawn between the low points on either side of the head peak is breached to the downside. The market is then expected to drop in an amount roughly equal to the distance between the head’s peak and the lows to either side of it. A schematic of this chart pattern and how to compute its measuring objective are shown in the image below.
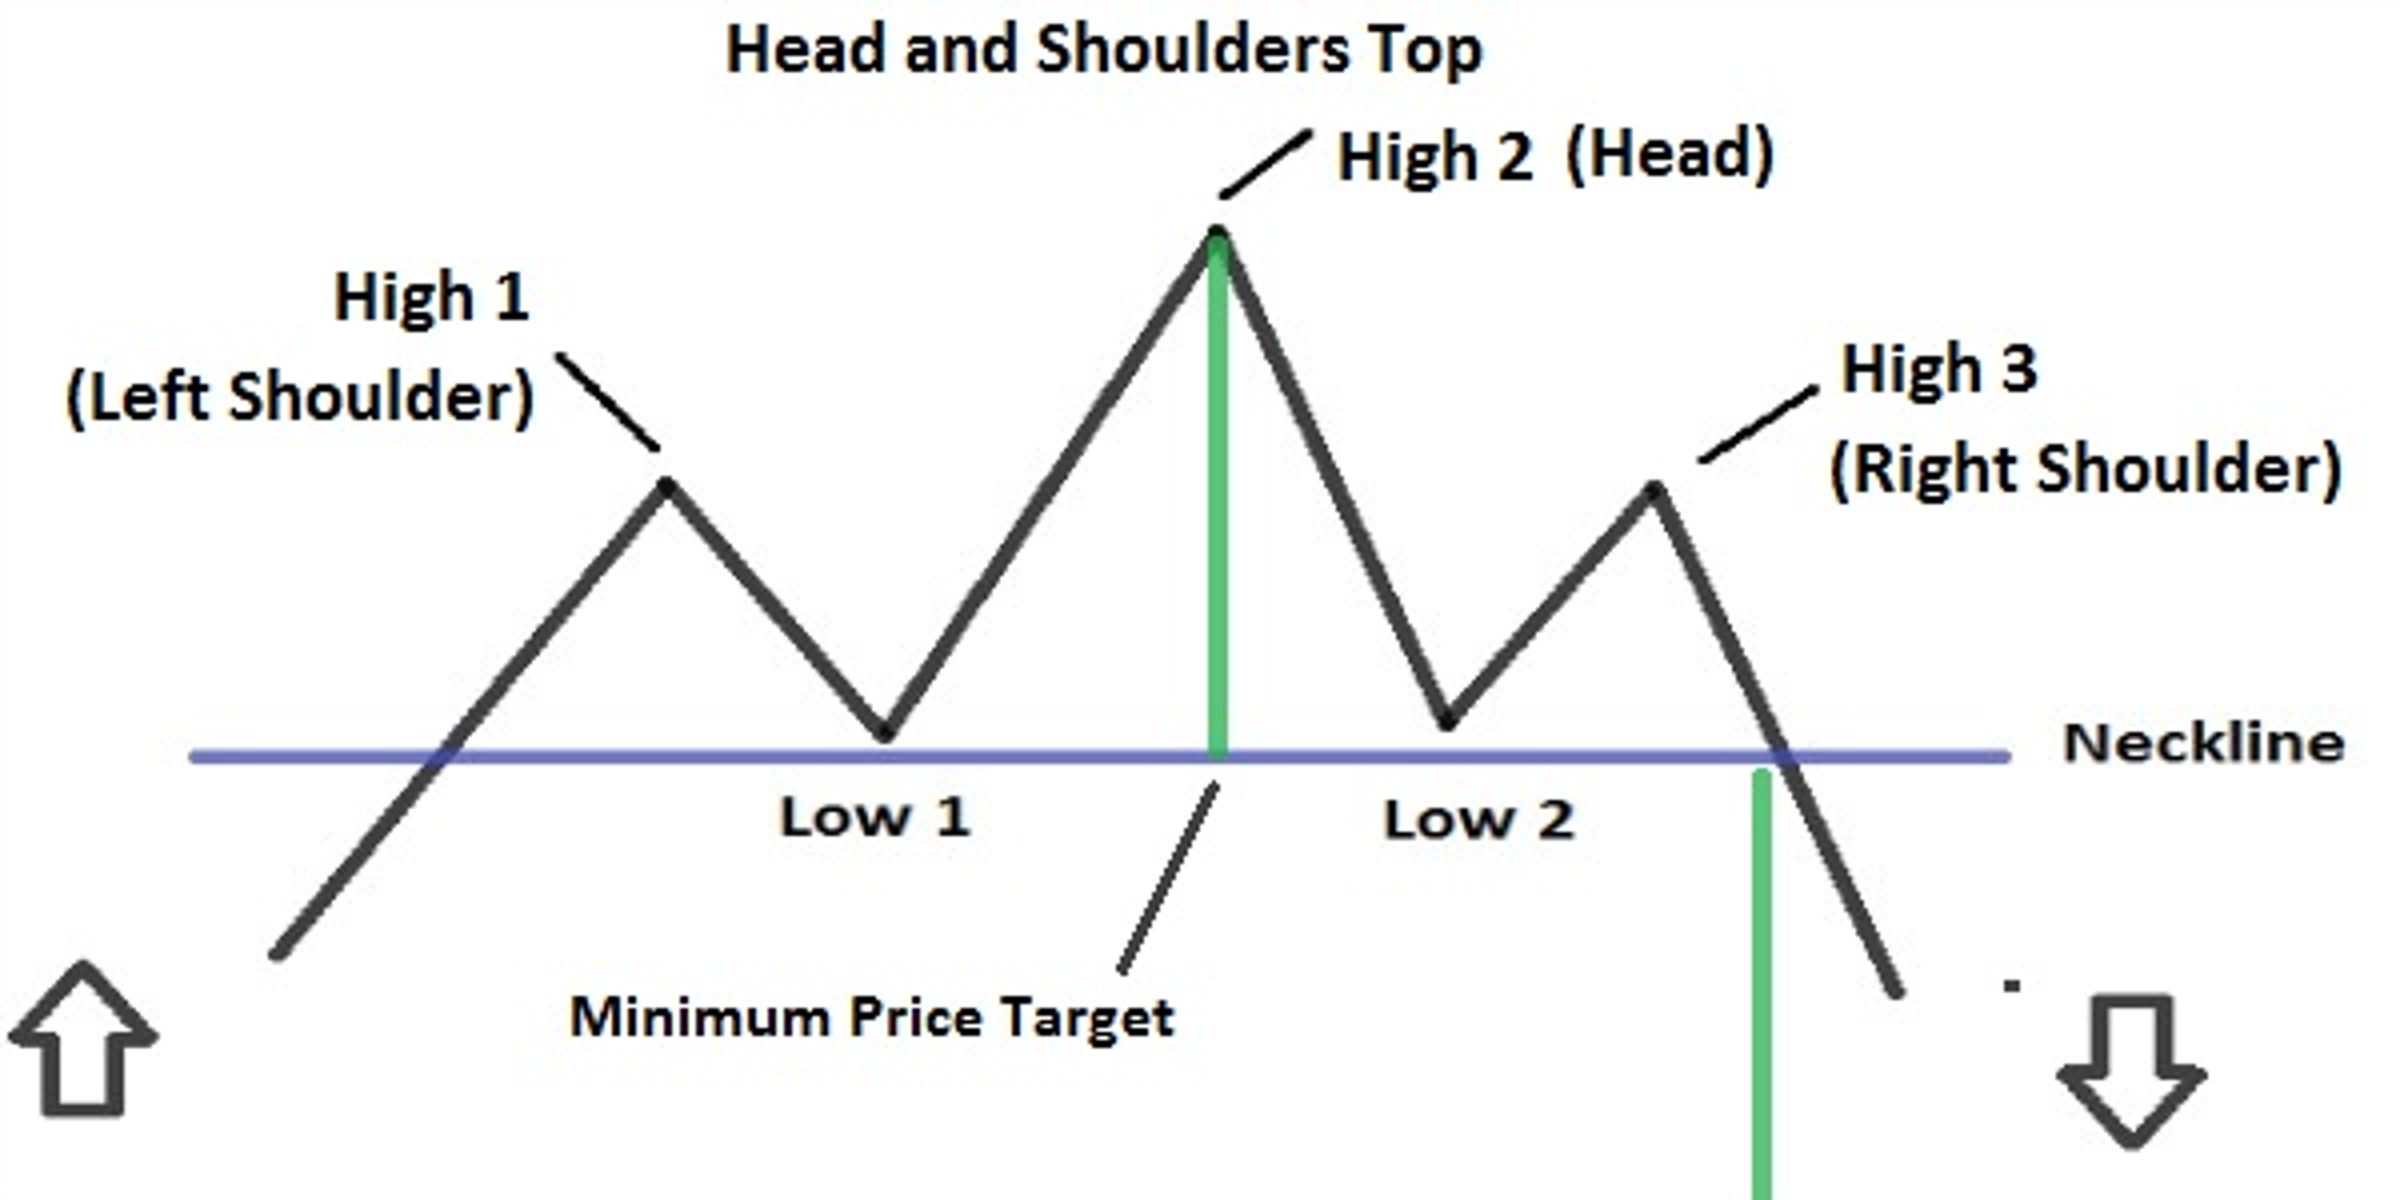
Schematic of a bearish head and shoulders top pattern. Source: Feedroll.
How to Trade Using a Head and Shoulders Pattern
Although the head and shoulders top and bottom patterns are considered quite reliable, traders who use this chart pattern need to watch out for failures. A failure occurs when the market move that breached the neckline to signal a trade is subsequently reversed to the point where that neckline is significantly breached in the opposite direction. Prudent traders will stop their trade outs when a failure happens — even if it means taking a loss.
Furthermore, valid head and shoulders patterns typically occur on longer-term exchange rate charts where they can develop over several days to years. While these reversal patterns can also successfully be traded on shorter-term intraday charts, they might not be as reliable.
Another fine point to keep in mind when using the head and shoulders pattern is that certain shifts in trading volume tend to accompany the different parts or legs of a valid pattern. Volume is often not considered as reliable a market observable in the less transparent over-the-counter forex market as it is in highly transparent exchange-traded financial markets like those for major stocks.
Forex traders can, however, use technical indicators based on tick volume to estimate trading volume with sufficient accuracy for this purpose. The availability of tick volume data allows currency traders to use popular technical indicators like Volume, On Balance Volume and the Chaikin Money Flow to analyze the validity of a head and shoulders pattern.
For a bearish head and shoulders top pattern, trading volume levels are typically higher during the rally that forms the left shoulder’s peak than those leading to the head’s peak. Volume should then fall overall until rising again during the right shoulder’s decline that ultimately leads to the neckline’s break to the downside. Observing this sort of volume pattern helps confirm that a valid head and shoulders pattern exists that can present a profitable trading opportunity.
When using this chart pattern in practice, you might first scan the forex market for a currency pair that exhibits a significant trend followed by a nearly complete head and shoulders pattern with an intact neckline. After drawing the neckline on the chart, you can then determine the distance from the neckline to the head’s extreme point. That distance is then projected from the neckline to compute the pattern’s measuring objective.
Watch the market closely at this point. If the neckline breaks, you could trade in the direction of the anticipated move and place your take-profit level just ahead of the measuring objective point you calculated. You should also place your stop-loss level safely behind the neckline, just in case the pattern fails.
Keep in mind that a substantial move on high volume should accompany the neckline break. Also, the market can hesitate and even retest the neckline shortly after breaking it. This retest can present an opportunity to get into a position if you missed the initial breakout, or you can use it to increase your position size at a better level if you managed to trade on the breakout.
A real-life example of this sort of phenomenon occurring in the EUR/USD currency pair after a head and shoulder bottom pattern broke out to the upside appears in the chart image below.

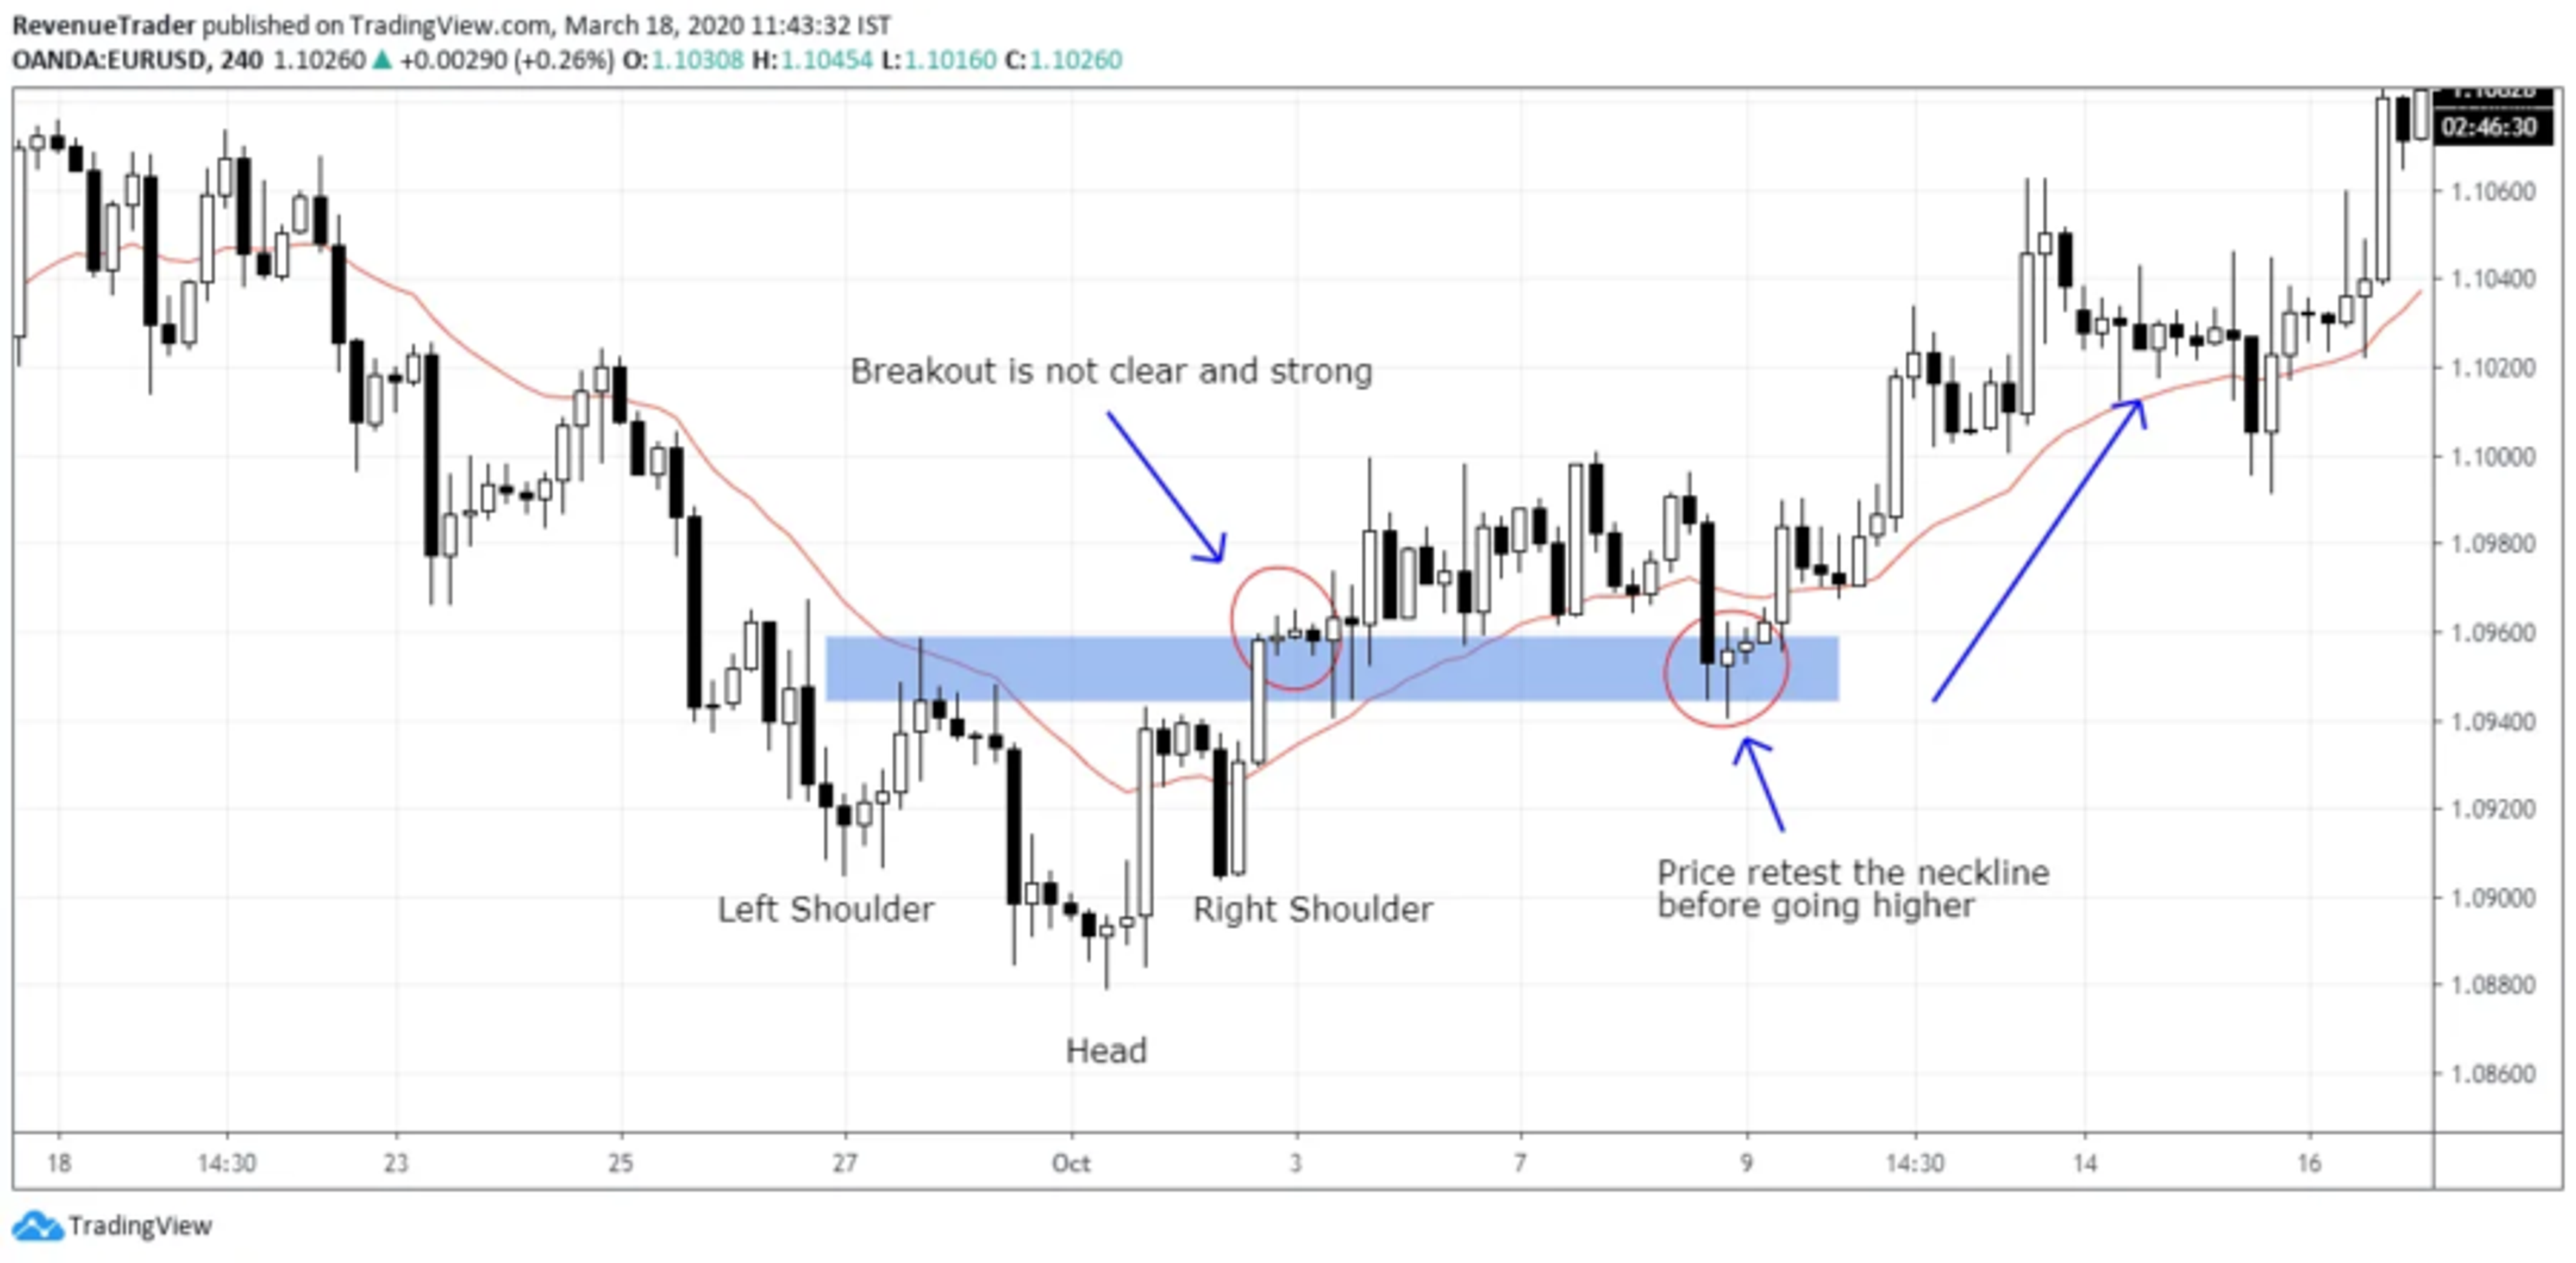
Head and shoulder bottom pattern in EUR/USD. Source: TradeRevenuePro.
How to Set Profit Goals with Head and Shoulders
The main way traders set profit goals using head and shoulders patterns is to project the distance between the neckline and the head from the neckline. You can then place your take-profit level just before the measuring objective level you calculated.
As shown in the EUR/USD example in the previous section, the market can sometimes hesitate or retest the neckline after a breakout before moving notably toward the measuring objective. In that case, you can just stay patiently with your position as long as your stop-loss level is not touched.
Why use the Head and Shoulders Pattern When Trading Forex?
Because the head and shoulders pattern is 1 of the most reliable classic chart patterns and provides clear trade-entry, stop-loss and take-profit levels, you should definitely consider using it if you plan on trading forex based on technical analysis.
Please come back to Benzinga for more information about trading currencies and other asset classes.
Frequently Asked Questions
What does head and shoulders mean in forex?
The head and shoulders top and bottom are classic chart patterns that signal a market reversal to technical forex traders.
Is reverse head and shoulders bullish?
Yes. A reverse head and shoulders pattern, often also called a head and shoulders bottom, is indeed a bullish chart pattern.
How effective is the head and shoulders pattern?
The head and shoulders pattern is considered one of the most effective and reliable trading patterns.
Get a Forex Pro on Your Side
FOREX.com, registered with the Commodity Futures Trading Commission (CFTC), lets you trade a wide range of forex markets with low pricing and fast, quality execution on every trade.
You can also tap into:
- EUR/USD as low as 0.2 with fixed $5 commissions per 100,000
- Powerful, purpose-built currency trading platforms
- Monthly cash rebates of up to $9 per million dollars traded with FOREX.com’s Active Trader Program
Learn more about FOREX.com’s low pricing and how you can get started trading with FOREX.com.
About Jay and Julie Hawk
Jay and Julie Hawk are the married co-founders of TheFXperts, a provider of financial writing services particularly renowned for its coverage of forex-related topics. With over 40 years of collective trading expertise and more than 15 years of collaborative writing experience, the Hawks specialize in crafting insightful financial content on trading strategies, market analysis and online trading for a broad audience. While their prolific writing career includes seven books and contributions to numerous financial websites and newswires, much of their recent work was published at Benzinga.