


Exxon Mobil Corporation XOM, the biggest U.S. oil company with more than $400 billion of market capitalization, has witnessed an unfavorable price action recently, struggling up and down the important 200-day moving average (DMA) at about $102 per share.
Exxon Mobil shares fell below their 200-DMA support on March 15, after maintaining above this level since December 2021. The momentum technical indicator, such as the 14-day relative strength index (RSI), also hit oversold territory for the first time since August 2021.
Attempts to reclaim the 200-DMA failed on Thursday and Friday last week, although the price action recovered marginally above this level on Monday this week.
It might too early to say if this technical breakthrough will be sufficient to dispel worries of more downside in Exxon Mobil, given the issues associated with the banking sector and its negative impacts on the economy are still far from solved.

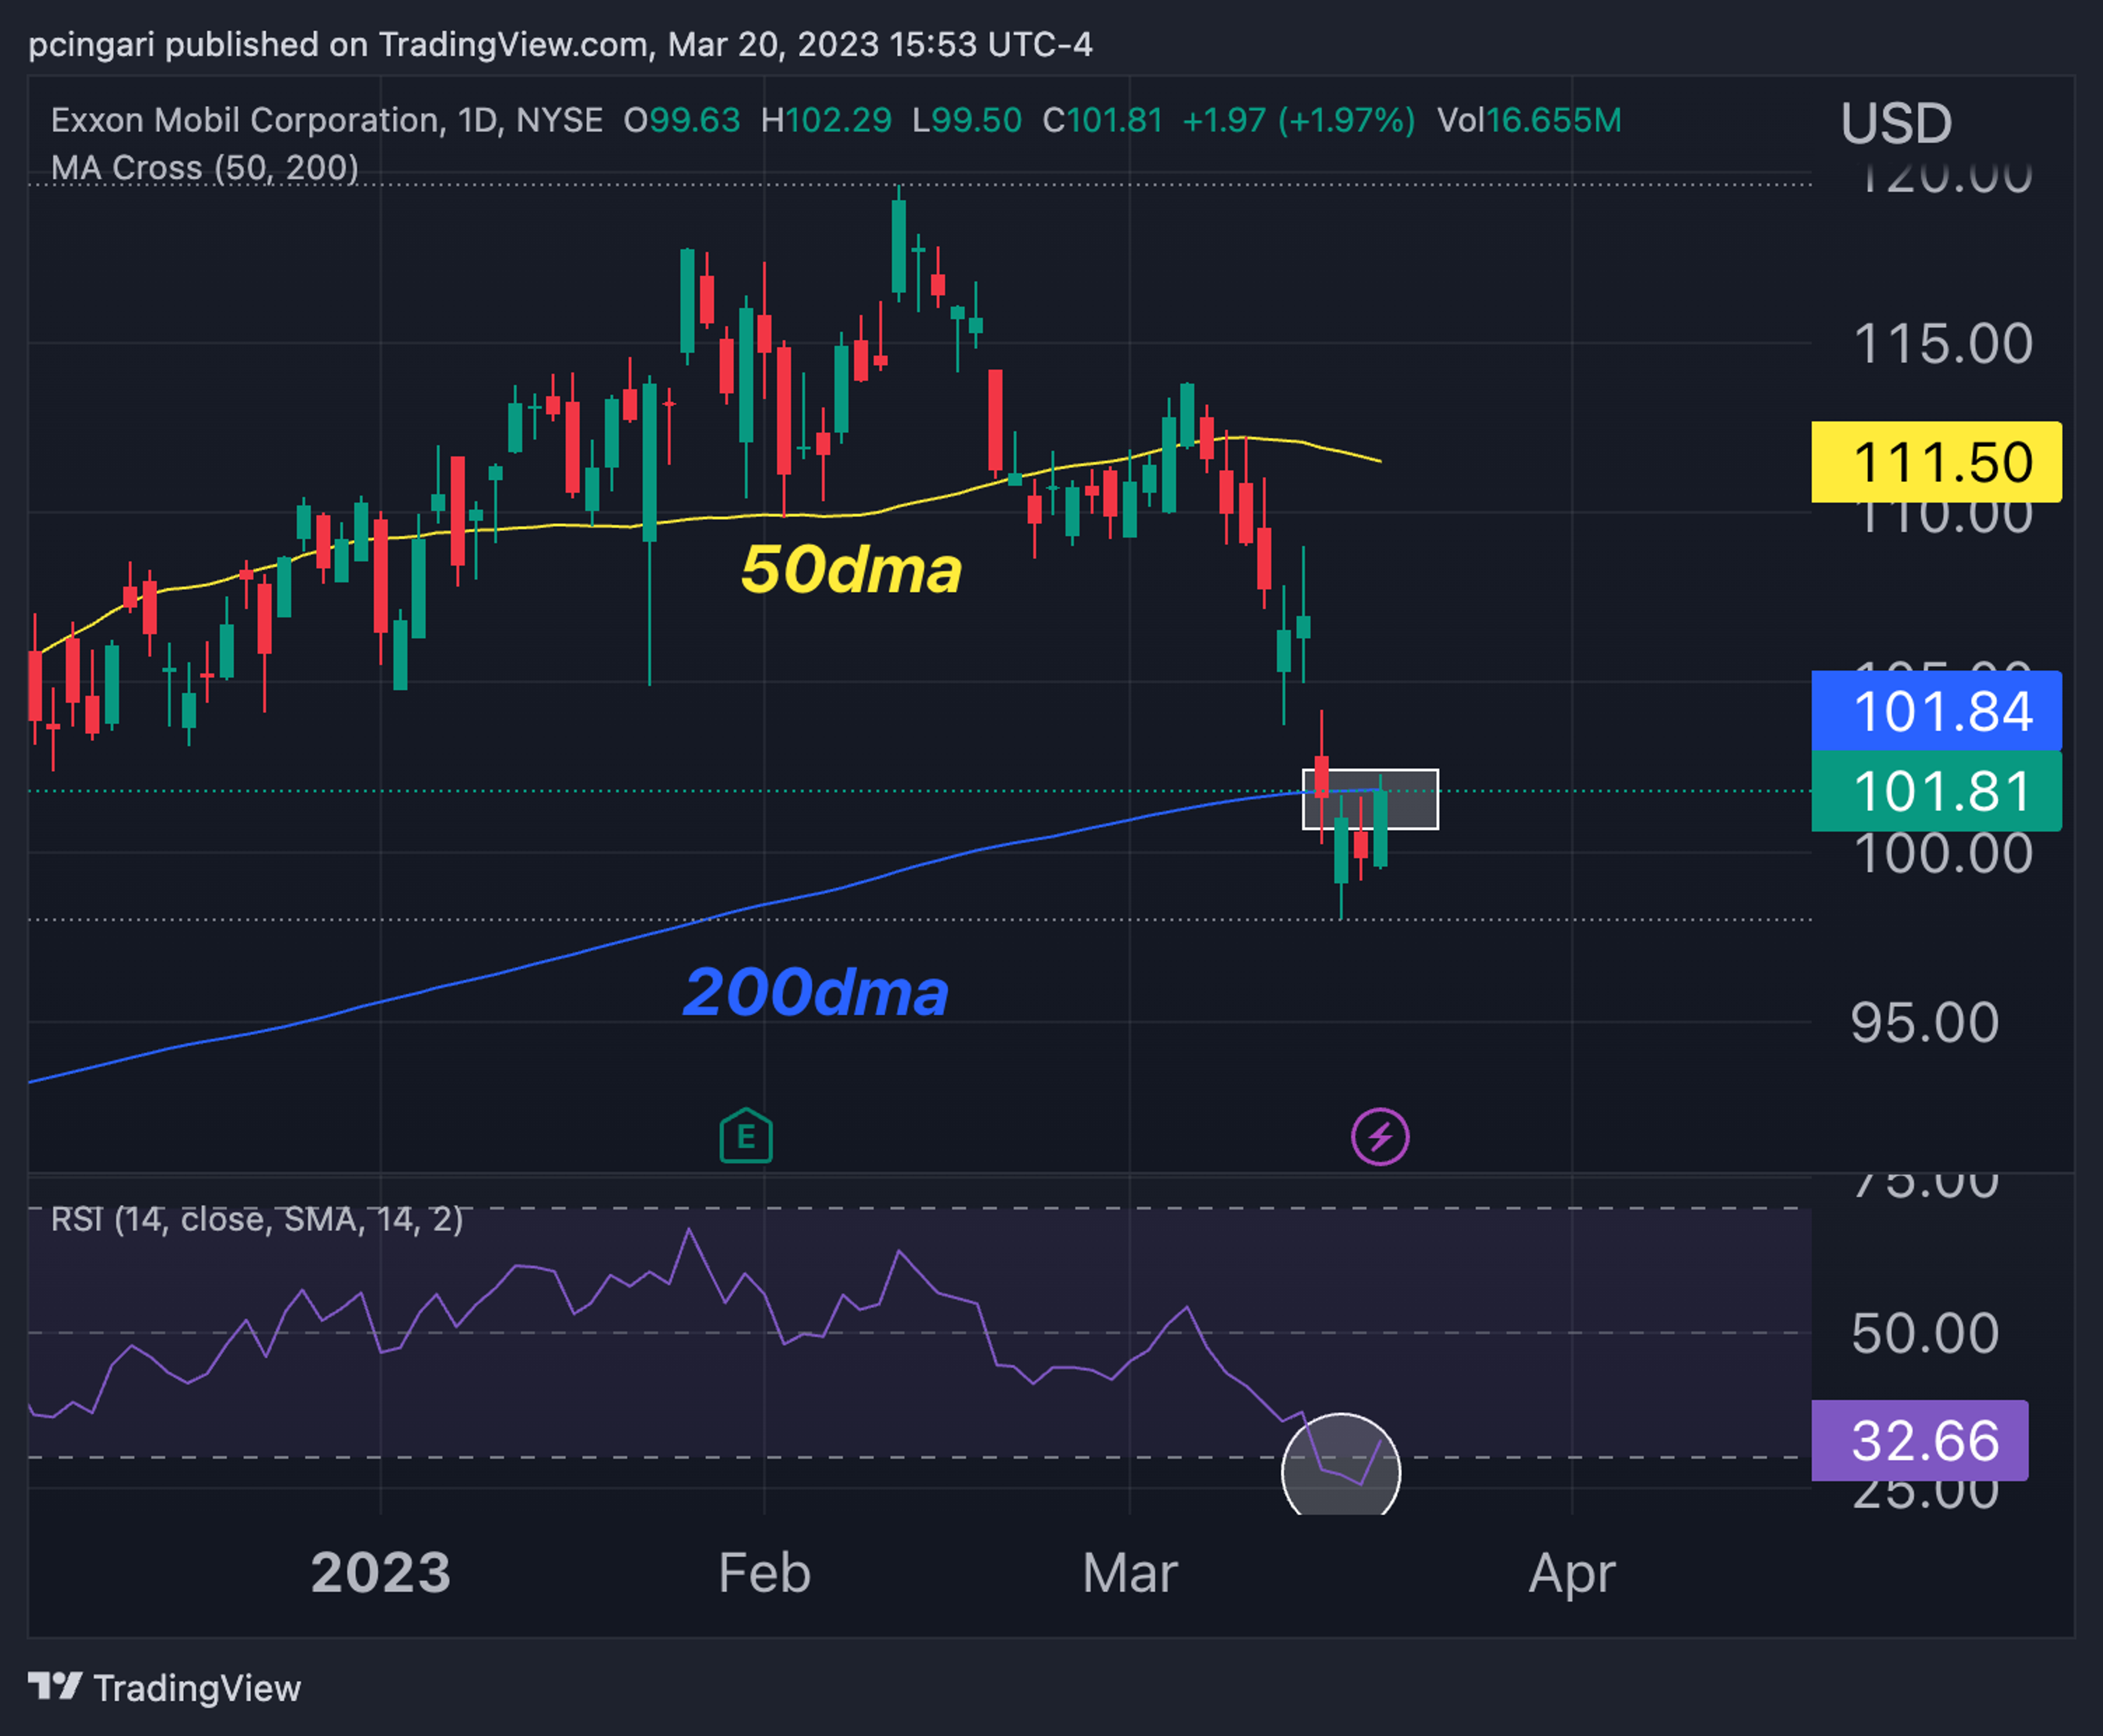
Exxon Mobil Corp. (XOM) Daily Price Chart: TradingView
XOM Trades “Rich” Compared to Oil Prices
WTI oil prices dropped 10% to $65 per barrel last week, marking their worst weekly performance since April 2020.
The turbulence in the banking industry is, of course, a major factor influencing oil prices, after the failures of tech startup-focused Silicon Valley Bank and New York's Signature Bank, as well as the takeover of Credit Suisse Group AG CS by UBS Group AG UBS over the weekend.
Read Next: Exxon Mobil Corporation Analyst Rating
The injection of international liquidity lifelines engineered by global central banks over the weekend resulted in a slight bounce in oil prices and risky assets on Monday. On Monday, the WTI price increased to $67.7 per barrel.
Yet, Exxon Mobil trades "rich" relative to current oil prices and the correlation has considerably weakened since October 2022, as price drops in the commodity have not been accompanied by a comparable fall in the stock price.
Exxon Mobil has a forward price-to-earnings ratio of 9.4, compared to the industry average of 11.6, according to Benzinga Pro data.


Oil WTI prices vs. Exxon Mobil Corp. – Chart: TradingView
Read More: ExxonMobil Reports Successful Startup Of Its Beaumont Refinery Expansion Project
Photo: Shutterstock
© 2024 Benzinga.com. Benzinga does not provide investment advice. All rights reserved.
Trade confidently with insights and alerts from analyst ratings, free reports and breaking news that affects the stocks you care about.

