


- Descending triangle breakout signals continuation of the rally from the July low $1204.70.
- Big jump in open positions in the call options points to bullish sentiment in the options market.
Gold (XAU/USD) looks set to test $1300 levels sooner rather than later. Prices may have retreated from yesterday's three-week high of $1287, giving an impression of a weak bullish move, although the price chart and the options market activity point indicate better days ahead of the safe haven yellow metal.
As of writing, the metal is trading at $1283.70/Oz levels.
Daily chart

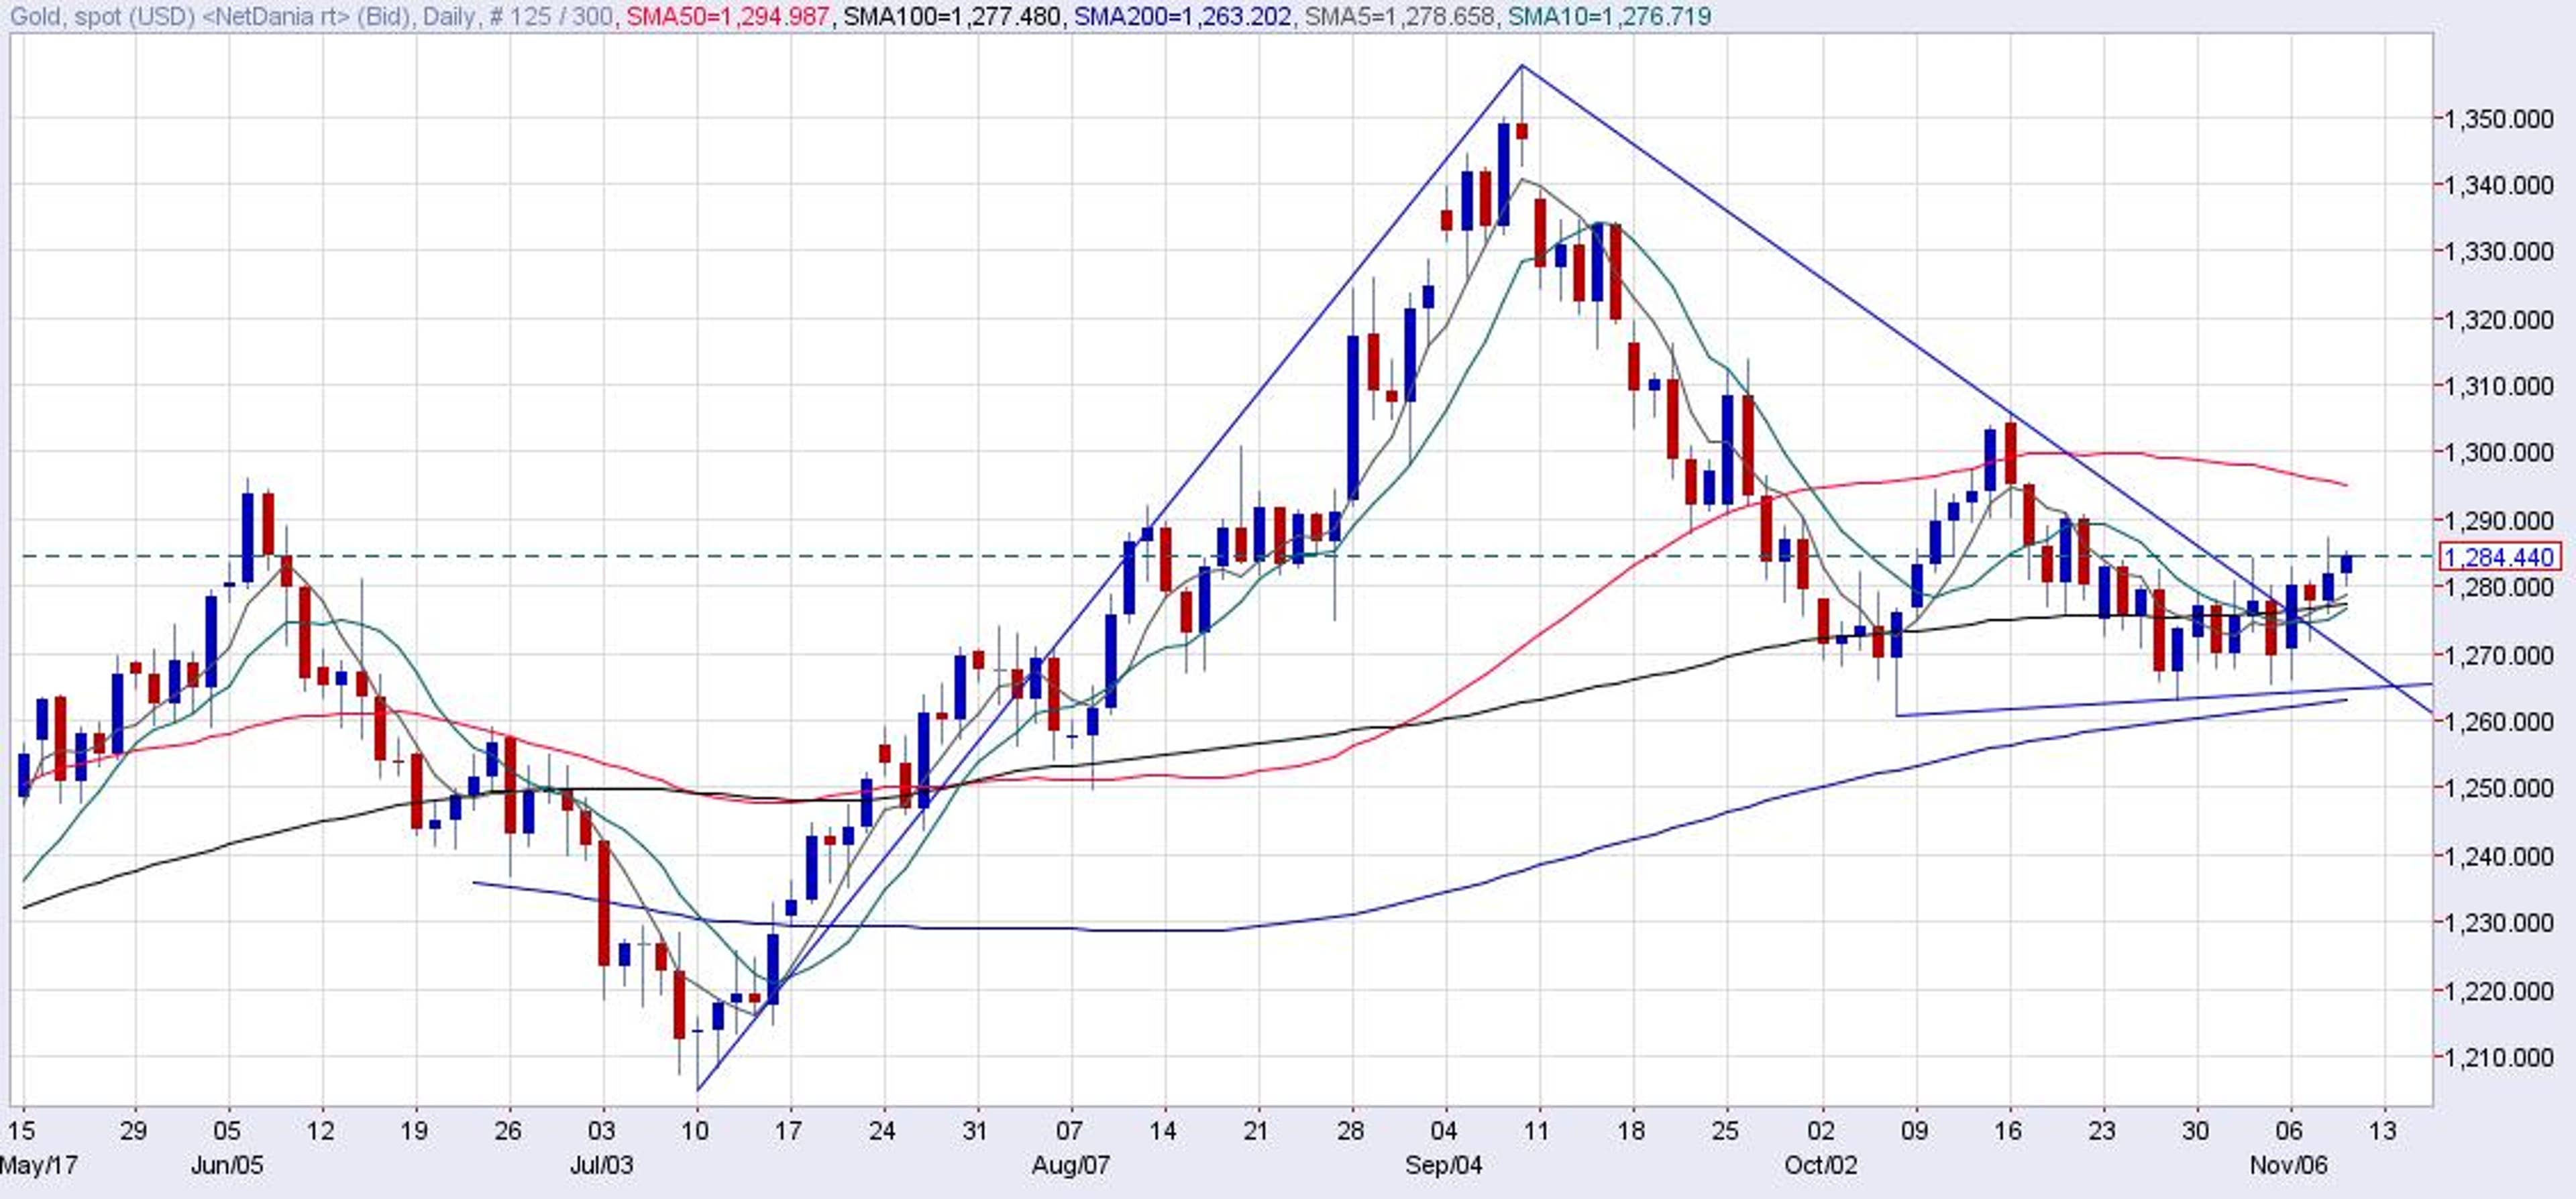
- The above chart shows a descending triangle breakout, which is a continuation pattern, meaning the rally from the Jul. 10 low of $1204.70 has resumed.
- The bullish breakout was confirmed on Nov. 6. Bears attempted to push the metal back below the trendline support on the following day, but failed.
- Clearly, the doors are open for a rally to $1300 levels.
- Only an end-of-the-day close below $1270 would abort the bullish view on the daily chart.
The bullish story doesn't end here. A look at the options market activity indicates strong demand for the bullish bets (call options).
Open interest change

Source: CME
The above chart shows-
- $1300 call has added 3304 contracts last week. Meanwhile, $1270 put added 1090 contracts.
- Big jump in the OI in $1300 call suggests the yellow metal is seen rallying at least to $1300 levels in the short-run.
View
- Gold is likely to test $1300-$1306.05 (Oct. 6 high). A violation there would confirm a double bottom reversal and shall open up upside towards the September high of $1357.52.
- On the downside, a break below the 200-day MA level of $1263 would revive the bearish move.
© 2024 Benzinga.com. Benzinga does not provide investment advice. All rights reserved.
Trade confidently with insights and alerts from analyst ratings, free reports and breaking news that affects the stocks you care about.

