


As the US Dollar is being sold-off with haste amid hope that the Federal Reserve is leaning more towards a third round of quantitative easing, the majors have rallied with relative ease the past day. Despite this, the Euro continues to lag high beta currencies and risk-correlated assets following a weak Spanish auction. The Bank of Spain sold 2-year notes earlier, and although they fetched 3.30%, demand was substantially weaker than it was last month, with the bid/cover ratio falling to 1.90 from 4.26. Similarly, the bid/cover ratio for 5-year notes dropped to 2.06 from 3.44.
While the results of the Spanish auction are shaking investor confidence in peripheral European debt, Italian sovereign credit continues to improve. The Italian 2-year note yield has dropped to 3.451% (-7.5-bps) while the Spanish 2-year note yield has increased to 5.088% (+19.3-bps). Similarly, the Italian 10-year note yield has dropped to 5.959% (-8.9-bps) while the Spanish 10-year note yield has risen to 6.932% (+5.8-bps); higher yields imply lower prices.
RELATIVE PERFORMANCE (versus USD): 10:40 GMT
AUD: +0.66%
NZD: +0.57%
JPY: +0.29%
CAD: +0.26%
GBP:+0.20%
CHF: +0.19%
EUR: +0.18%
Dow Jones FXCM Dollar Index (Ticker: USDOLLAR): -0.30%(-1.56% past 5-days)
ECONOMIC CALENDAR

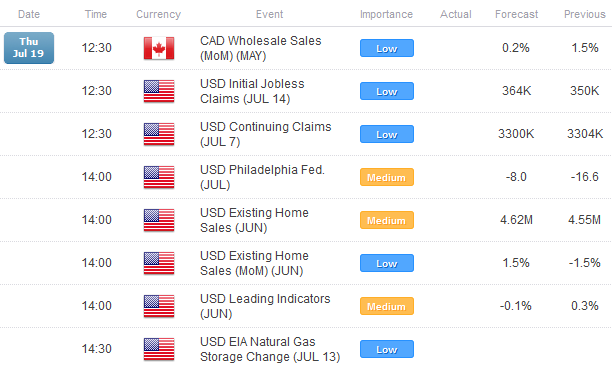
The docket is thin today after various important releases earlier in the week, but there are still a few items of interest that are worth keeping an eye on. At 08:30 EDT / 12:30 GMT, USD Initial Jobless Claims for the week of July 7 are due: the rebound last week was due to “seasonal concerns,” so seeing a continuation of the trend of lower claims would bolster sentiment. At 10:00 EDT / 14:00 GMT, USD Existing Home Sales for June and the USD Philadelphia Fed Index for July will be released: the former is expected to see a modest uptick, erasing the losses from May; while the latter should signal a slight rebound in manufacturing in the mid-Atlantic region.
TECHNICAL OUTLOOK
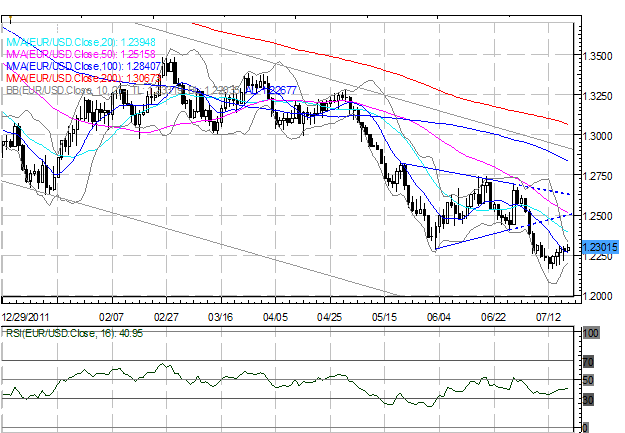
EURUSD: The EURUSD continues to flag higher, range bound with higher highs and higher lows, but that changes little when looking at the pair beyond just a few days. We remain bearish as the pair has yet to complete its measured move from its May 1 decline, and over the coming six-weeks, we are looking for a sell-off into 1.1695-1.1875. Near-term resistance comes in at 1.2315/20 and 1.2360/65. Above that, interest lies 1.2400, and the crucial 1.2440/80 zone (Symmetrical Triangle support). Support comes in at 1.2255/65, 1.2200/05 (Bollinger Band), 1.2175/90 (lows from Monday and Tuesday), and 1.2160/65 (July lows).
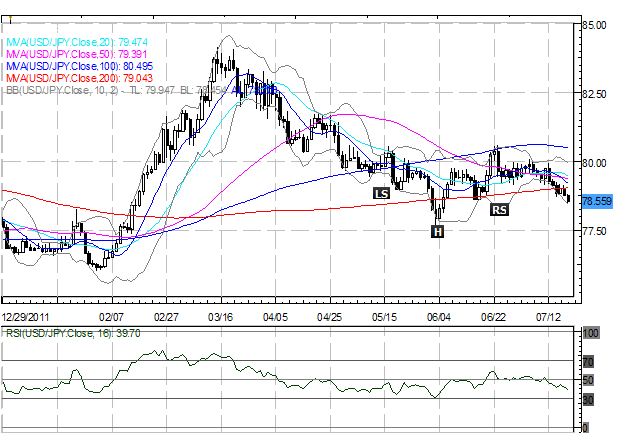
USDJPY: Is the USDJPY is working on an Inverted Head & Shoulders pattern off of the June 1 low? It certainly appeared so for a while there, but the bullish pattern is in question now that the Right Shoulder has broken as support, and our interest lies in seeing if there is a daily close below it at 78.60. If so, we suspect further losses towards 78.15/25. Still, as long as the Head at 77.60/70 holds, the pattern remains technically valid. With the Head at 77.60/70, this suggests a measured move towards 83.60/70 once initiated. Near-term resistance comes in at 79.00/05 (200-DMA). Price action to remain range bound as long as advances are capped by 80.60/70.
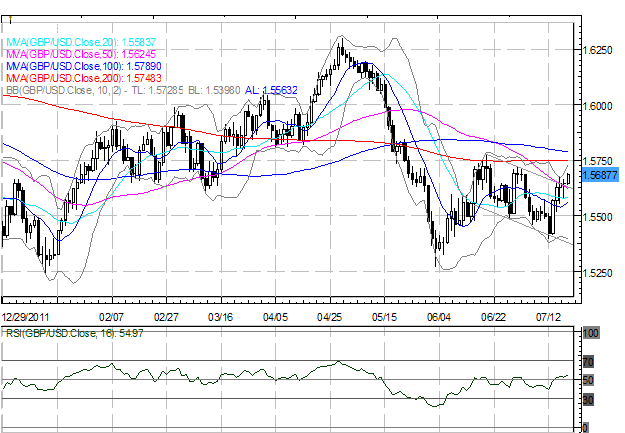
GBPUSD: The pair closed above its 50-DMA yesterday and broke out of a short-term descending channel, in what perhaps may be a Bull Flag on the 4-hour/daily charts. Near-term resistance comes in 1.5720/25 (former swing high), and a close above this level will signal the beginning of a measured move up towards 1.5890/1.5905. Above that, selling interest could return at 1.5745/50 (200-DMA) and 1.5775/80 (June high). Near-term support comes in at 1.5580, 1.5460/65 then 1.5390/1.5405 (monthly low, Bollinger Band).
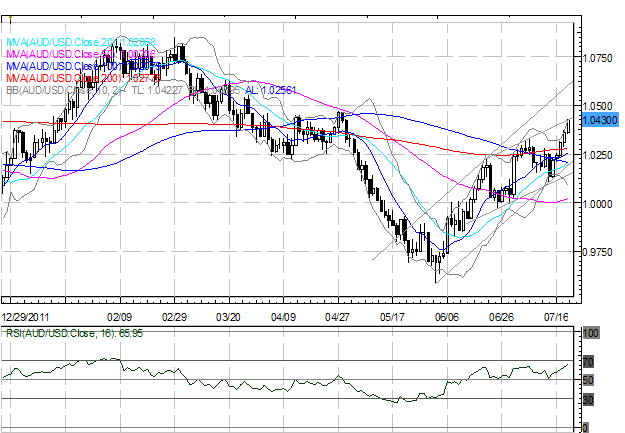
AUDUSD: The pair is working higher in two separate ascending channels, hitting resistance at 1.0430 in the less steep of the two. A daily close above this level signals a rally further up into 1.0470/75 (April high). However, short-term charts are looking overextended at current price, so it's possible there is some consolidation/downside price action before the next leg higher. Near-term support comes in at 1.0385, 1.0325/30, and 1.0135/55.
--- Written by Christopher Vecchio, Currency Analyst
To contact Christopher Vecchio, e-mail cvecchio@dailyfx.com
Follow him on Twitter at @CVecchioFX
To be added to Christopher's e-mail distribution list, send an e-mail with subject line "Distribution List" to cvecchio@dailyfx.com
© 2024 Benzinga.com. Benzinga does not provide investment advice. All rights reserved.
Trade confidently with insights and alerts from analyst ratings, free reports and breaking news that affects the stocks you care about.

