
Bitcoin (CRYPTO: BTC) saw a massive fall on Friday to the tune of about 15%, but given its strong correlation with the NASDAQ 100 it’s not surprising to see that when the NASDAQ 100 has a strong directional day or trend, Bitcoin tends to follow suit.


The weekly chart of Invesco QQQ Trust Series 1 (NASDAQ:QQQ) shows a strong rally off the June 15 bottom, and is now hitting major Fibonacci resistance at both the 50% and 61.8% retracement levels from the recent high and pullback.
The next two weeks will be very important to determine how the NASDAQ 100 and other major indices will play out directionally given the earnings, macroeconomic and geopolitical catalysts in the near-term.
The price action is showing there is a twin tower candle pattern setup with the 20-week simple moving average (SMA) that is currently flattening out. If the price action finds support at the 20-week SMA in the next few sessions and bounces, then further upside is possible.
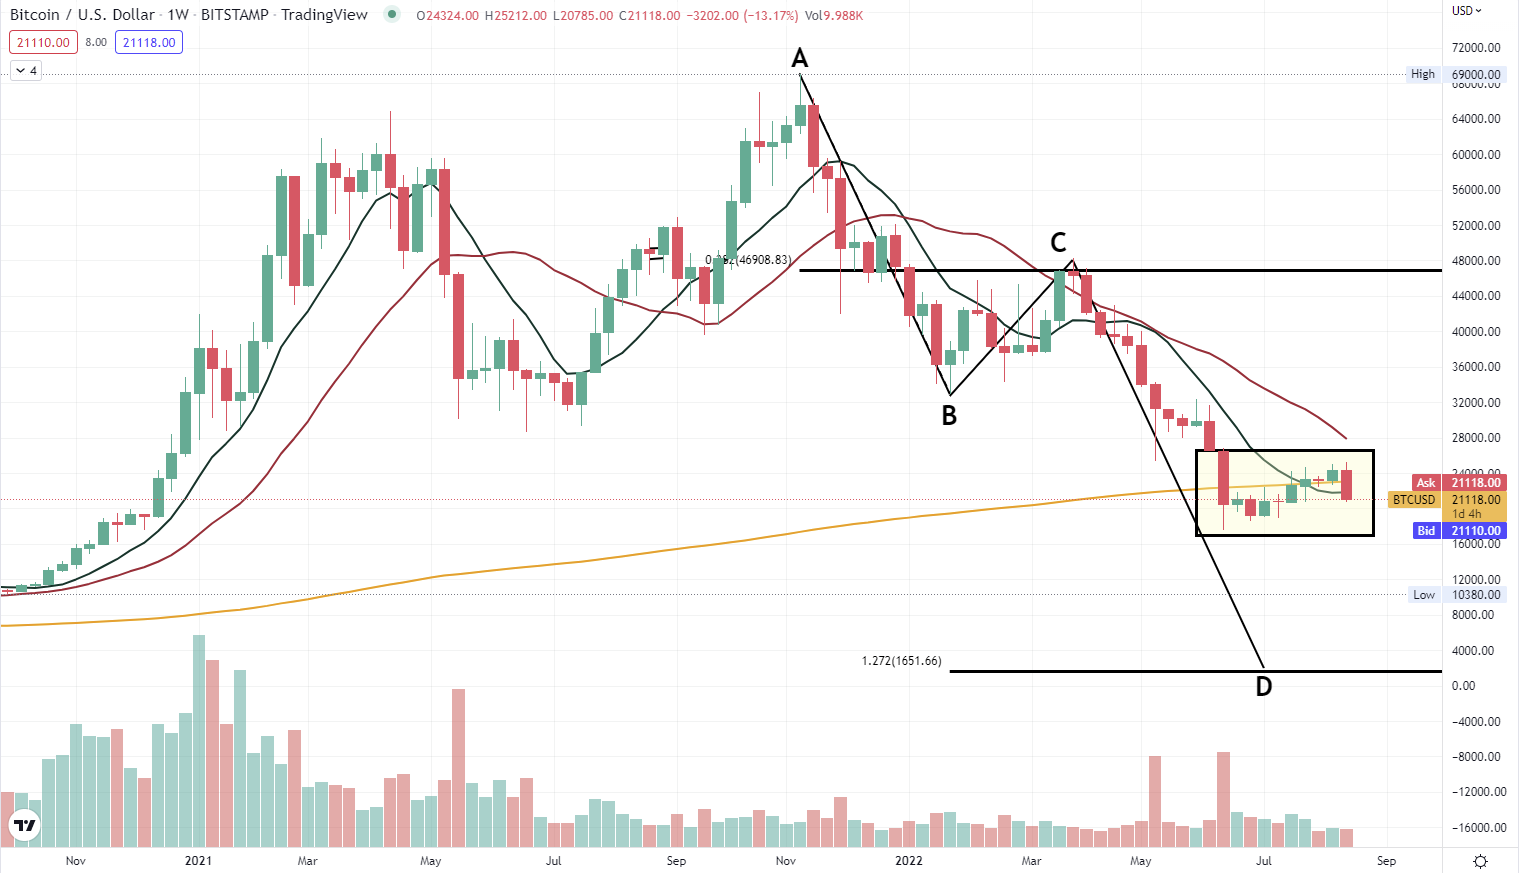
However, from the opposing perspective, this has all the hallmarks of a traditional harmonic ABCD pattern to the downside. The initial ABCD was made from the recent high to low (Jan. 3 – June 15) which also corresponds to the longer AB leg and a descending wedge pattern.
More recently, the price action is within the longer BC leg. If the price action were to reverse, the 200-week SMA (orange line on chart) would act as the first area of support, and if the trend continues thereafter, traders and investors would see a potential move lower.

Bitcoin has seen 3 legs lower on the daily time frame since its April highs, where the 200-day SMA acted as strong resistance. As of late the price action has been in a major consolidation phase since mid-June and Friday’s price action saw a large red Maruboza candle off the 20-day SMA which history suggest has an over 80% chance of follow through to the downside.
A simple rule of thumb is within a trending market, 3-5 legs are created in the direction of the current trend around 70% of the time before a potential reversal.

Taking a peek at the weekly chart, Friday’s price action gave a strong signal for potential further downside as a bearish engulfing candle was made, and broke below both the 200-week SMA.
Price is still within the upper 50% of the consolidating range, but a continued breakdown below the 200-week SMA could signal a potential free fall and mass liquidation by institutions. The longer term ABCD pattern to the downside is still intact.
© 2025 Benzinga.com. Benzinga does not provide investment advice. All rights reserved.