


BTC/USD Technical Analysis: Perfect Textbook Technical Pattern Is Very Close To Being In Play
The head and shoulders pattern is one of the most famous in technical analysis.
Now it seems on the 4-hour chart BTC/USD is forming a perfect one.
If the price breaks and closed above 7,400 that will trigger a potential upside target of between 8K and 8,200.
With the head and shoulders pattern the target is based on the pattern length.
-637104693491285756-637104810422500869.png)
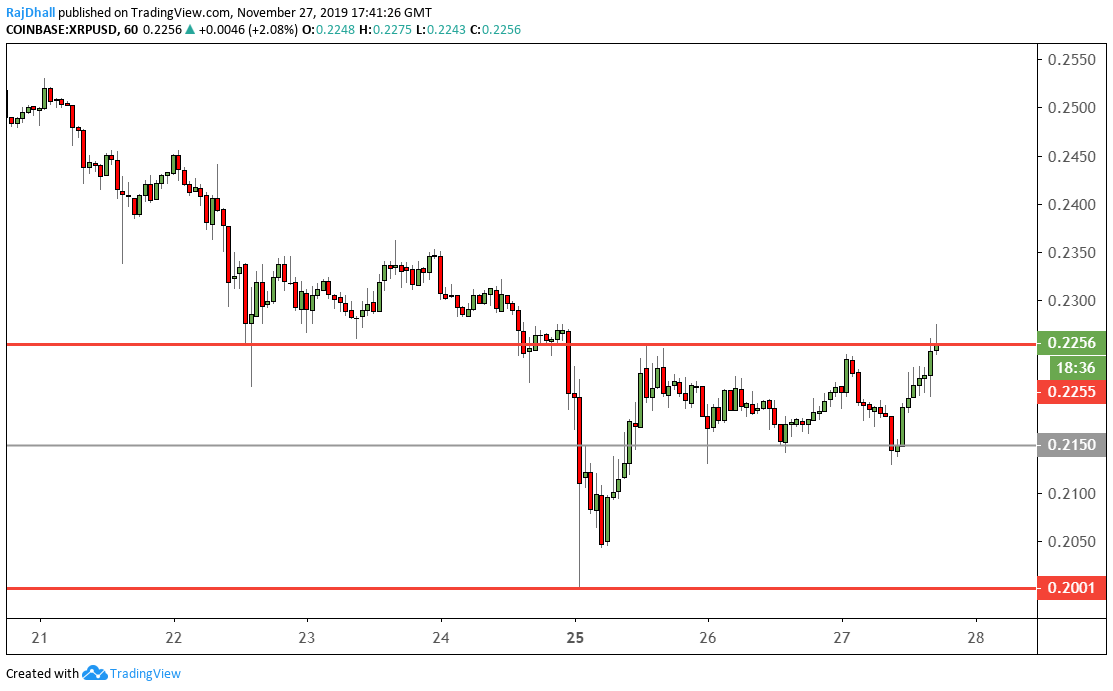
XRP/USD Technical Analysis: Ripple breaks higher but can it sustain the move?
As you can see from the chart below the price has recently shot higher.
The 0.2255 level has been used on a number of occasions as a support and resistance level.
The next potential resistance lies at 0.2355 which has been respected on three occasions.
LTC/USD Technical Analysis: This resistance level is hitting the price hard intraday
Looking at the hourly chart below its clear to see that the 47.22 level is giving LTC/USD some trouble.
Bitcoin, on the other hand, has broken higher and maybe this can have a lagging effect on Litecoin.
Longterm. this level was pretty significant back on 23rd October as it was where price found support after a heavy drop.
-637104645256926942-637104810832825108.png)
Image Sourced from Pixabay
© 2024 Benzinga.com. Benzinga does not provide investment advice. All rights reserved.
Trade confidently with insights and alerts from analyst ratings, free reports and breaking news that affects the stocks you care about.

