


Loading...
Loading...
BTC/USD Technical Analysis: The Main Support Is Still Holding
- Now the BTC/USD chart is still looking weak with lower highs and lower lows.
- But the trend will be confirmed on the downside when 7,296.44 breaks lower.
- There is also a channel forming which is represented by the blue lines.
- What is interesting about the recent price drop is that the two prior candles were not overly bearish.
- Momentum looked like it was slowing on the downside but all of a sudden in the EU session the support levels broke.

-637099513084154325-637099660229883494.png?optimize=medium&dpr=2&auto=webp&width=3840)
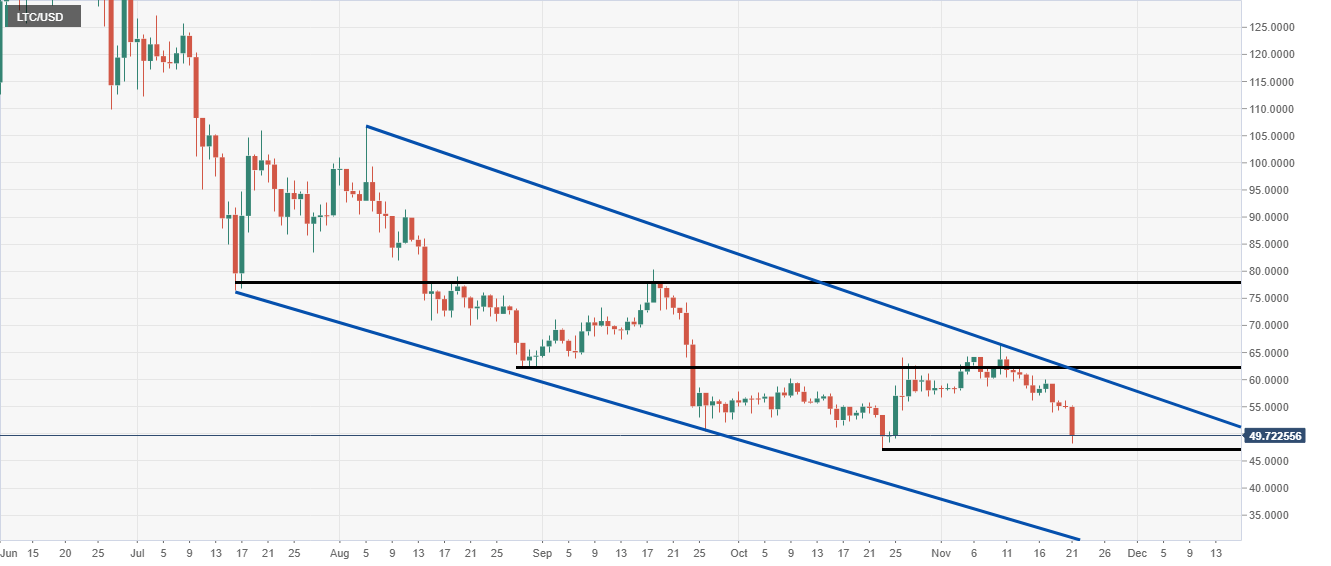
LTC/USD Technical Analysis: 50.00 Has Broken To The Downside
- LTC/USD is still looking bearish after the psychological 50.00 level broke.
- It is one of the worst-performing crypto's today after the heavy fall earlier in the session
- Now 47.22 is in focus as it is the previous wave low, but the selling momentum has slowed down.
- There is a channel formation marked in blue to keep an eye on too.
Ripple's XRP Technical Analysis: XRP/USD Flirting With Game-Changing Demand Zone
- Ripple's XRP price is trading in the red by some % in the session on Thursday.
- XRP/USD bears continue to flirt with the big support area seen at $0.2500.
- Critical weekly support should be noted at $0.2350, failure to hold could be punishing.

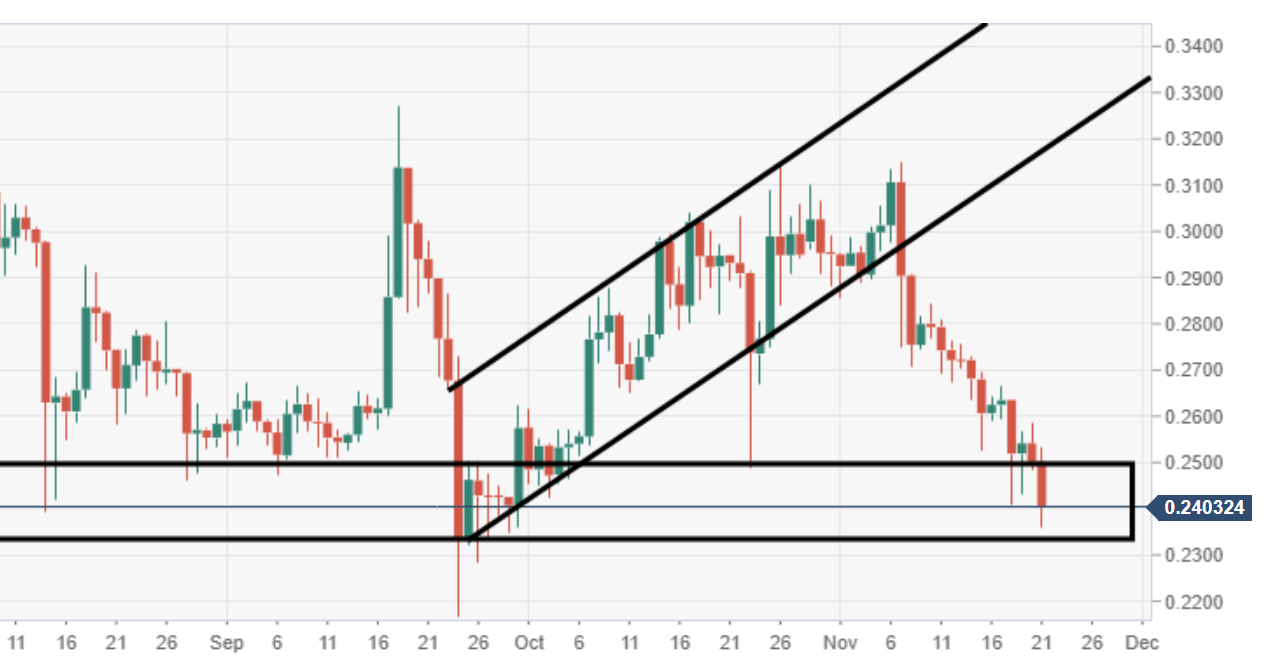
Image Sourced from Pixabay
Loading...
Loading...
© 2024 Benzinga.com. Benzinga does not provide investment advice. All rights reserved.
Posted In: CryptocurrencyNewsEurozoneForexGlobalMarketsTechGeneralBitcoincrypto marketEthereumFXStreetripple
Benzinga simplifies the market for smarter investing
Trade confidently with insights and alerts from analyst ratings, free reports and breaking news that affects the stocks you care about.
Join Now: Free!
Already a member?Sign in

