


- The catastrophic mantras reappear while the sector prepares for new rises.
- ETH/USD continues to consolidate the 80% leap from the lows.
- Today may be a good day for the Ripple, eyeing a fundamental level between $0.45 and $0.50.
The arrival of the new year brings Bitcoin ETFs back to the headlines. Yesterday, a positive outlook was announced from Japan regarding the possibility of approving one of these investment instruments. In the Land of the Rising Sun, Bitcoin is broadly accepted as a medium of payment and, the country of origin of its creator, Satoshi Nakamoto, so it would not be strange that it was there where the first ETF is approved.
Also in this sense, the Winklevoss brothers, founders of the Gemini exchange, insisted on their intention to achieve a Bitcoin ETF approval as soon as possible.
Yet in cryptos as in cryptos, we also return to the statements from outstanding members of the financial establishment crying out the evils of the cryptocurrencies and predicting an abrupt end of "this fairy tale."
Yesterday it was Ardo Hansson’s, an economist trained at Harvard and the current governor of the Bank of Estonia. During 2018 Mr. Hansson was quoted as a candidate to succeed Mario Draghi at the helm of the ECB.
‘Bitcoin will die as a complete load of nonsense' says Ardo Hansson in an event in Lithuania. Hansson, 60, a member of the Governing Council of the European Central Bank, is the first senior member of the ECB to state his opinion on Cryptocurrencies openly.
BTC/USD is currently trading at the $3.993 price level after a first unsuccessful attempt to breach the EMA50. For today we can expect a hesitant start that is likely to improve during the day and enter a new bullish phase in the last hour of the day. The 30-minute chart supports this scenario.
Above the current price, the first objective is to exceed the 50-period exponential average at the $4,139 price level. The second bullish target is $4,409 (price congestion resistance). The third target on the upside is around $5,000 (price congestion resistance and SMA100).
Below the current price, the first level where BTC/USD would find support is at $3,930 (price congestion support). The second support level is at $3,600 (price congestion support). If the BTC/USD drops this level, it could lose the entire current bullish momentum. Finally, the third support level is $3,250 (price congestion support).


The MACD on the daily range recovers the bullish slope and is in the positive zone of the indicator for the first time since September. If there is a right time to move up, it is now.
The DMI in the daily range shows us how bulls outperform bears and are positioned for further price hikes. The negative side is that the bears do not retreat and maintain the same level as in previous days.
The ETH/USD pair is currently trading at the $150.25 price level. Today's trend will be slightly bullish, although the $155 level may be hard to beat. Towards the end of the session, it is likely that sellers will appear again.
Above the current price, the first resistance level is $154.25 (price congestion resistance). The second resistance level is at $164 (SMA100). Above this second resistance level, there are resistances at $170 (price congestion resistance) and $180 (price congestion resistance), but the crucial one is at $190 (price congestion resistance and long-term bear channel ceiling).
Below the current price, the first level of support is at $143 (price congestion support). The second support level is at $138 (EMA50). The third level of support is at $125 (price congestion support).
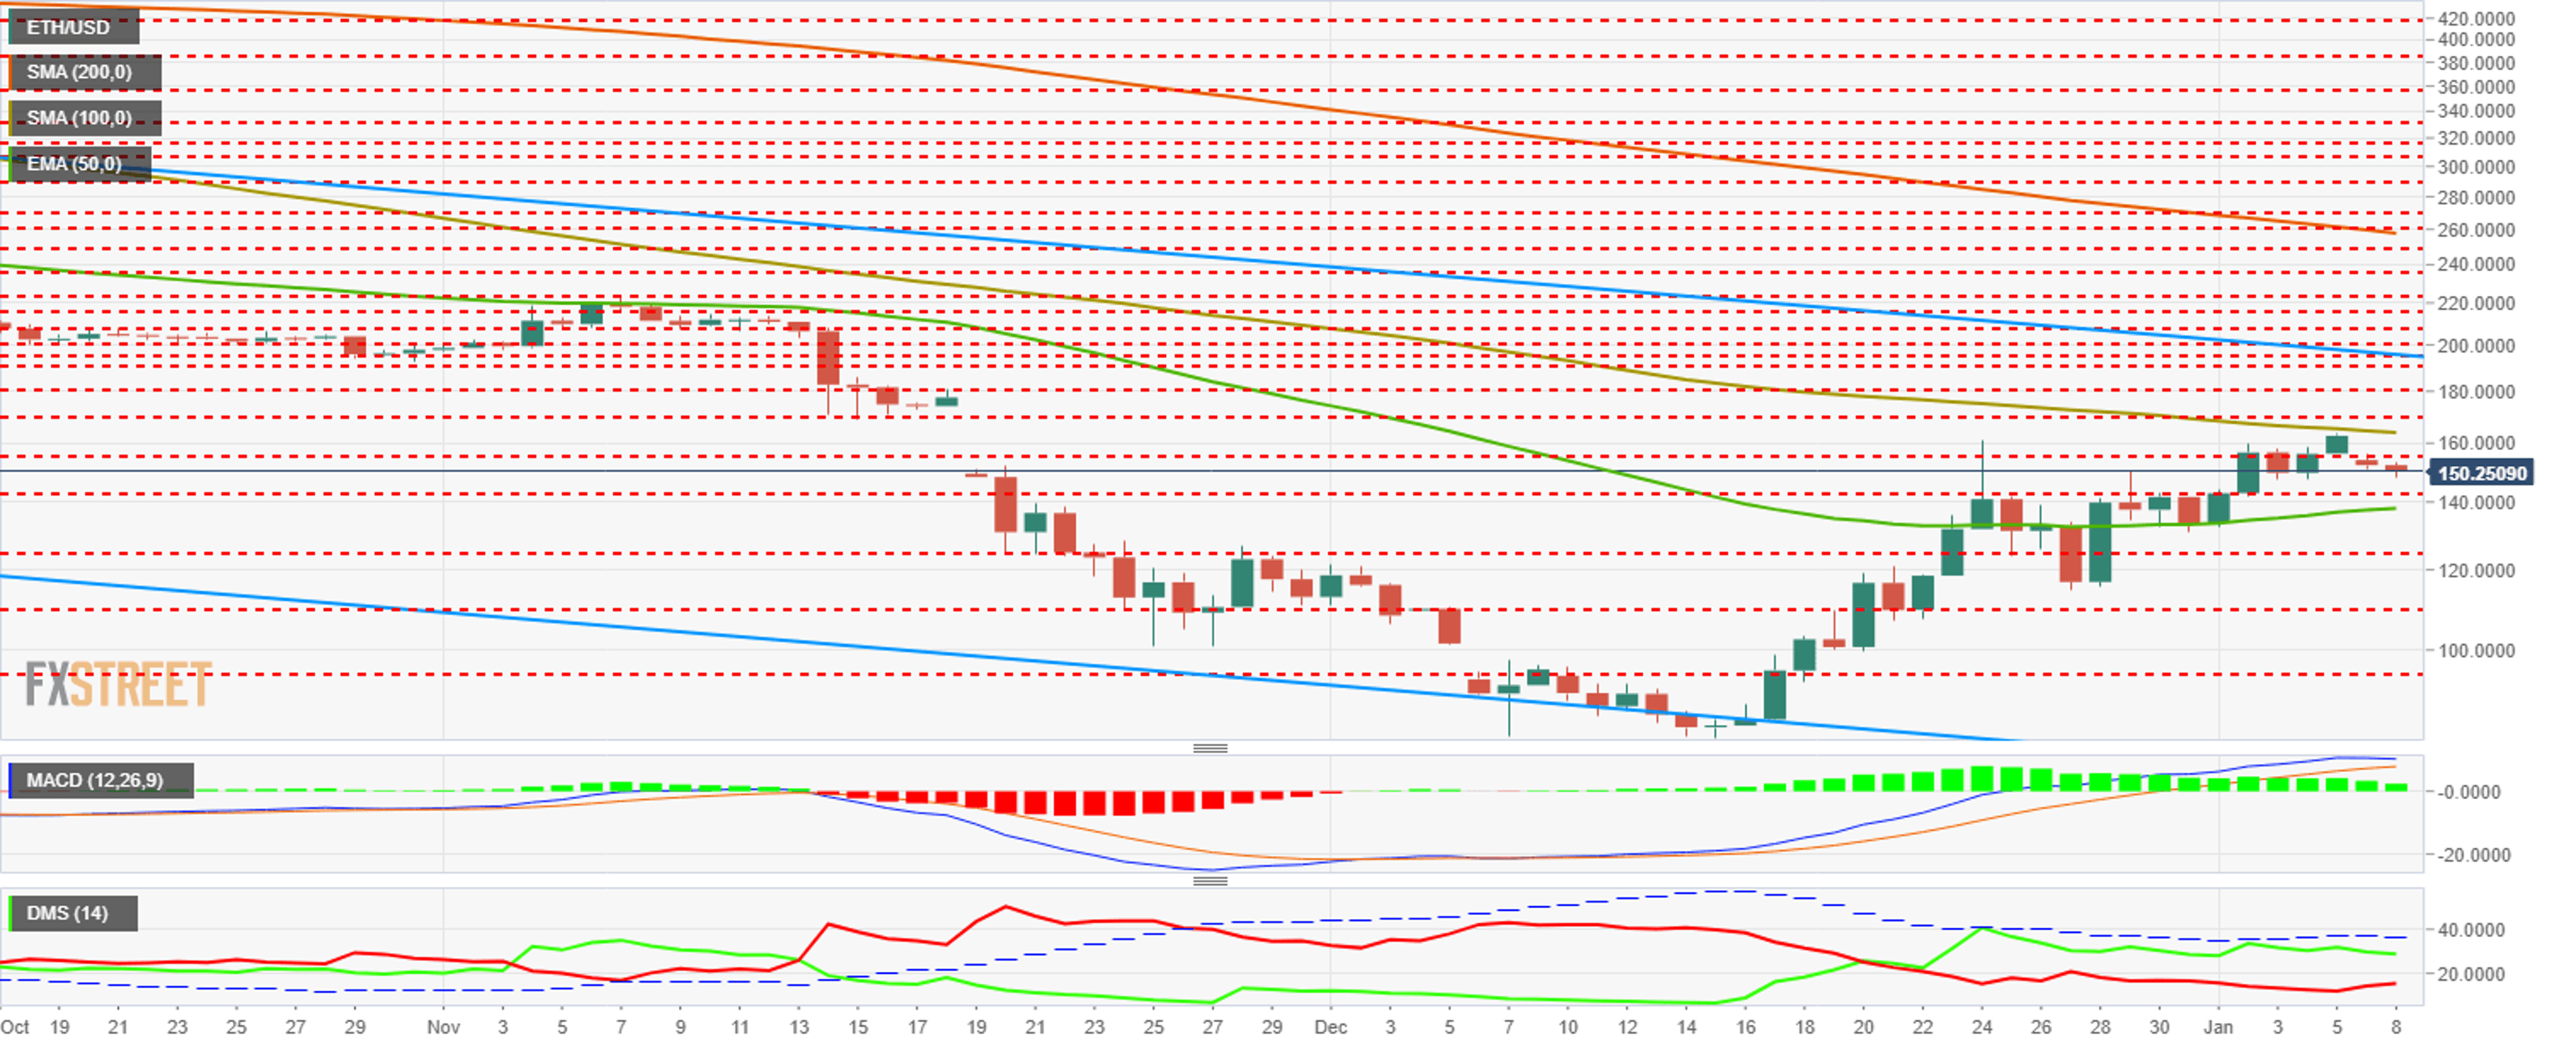
The MACD in the daily range shows a pattern of exhaustion of the bullish movement from the lows. This process does not mean that massive sales are coming, but it can produce an orderly consolidation.
The DMI in the daily range shows how the bears have increased their activity in the last three days. The bulls for their part have not faltered and remain at levels similar to those of last week.
XRP/USD Daily Chart
XRP/USD is currently trading at the $0.366 price level. Today's trend is expected to be bullish for at least part of the session. Intraday charts show very positive formations.
Above the current price, the first resistance level is at $0.3654 (EMA50), a resistance level that Ripple has tried to overcome unsuccessfully over the past two weeks. Above this resistance, the XRP/USD pair can fly higher. The second resistance level is at $0.413 (price congestion resistance and SMA100). Above this level, there are two more resistance levels at $0.422 (SMA200) and $0.429 (price congestion resistance), but the key resistance level is at $0.45 (trend line and ceiling of the long-term bear channel).
Below the current price, the first support level is $0.345 (price congestion support). The second support level is at $0.321 (price congestion support). The third support level is $0.30 (price congestion support).

The MACD in the daily range does not accompany the normal short-term development but remains in positive territory so it can react at any time.
The DMI in the daily range shows us the bulls maintaining the advantage over the bears. The bullish ones stay a little above the 20 levels so they can quickly react to the upside.
© 2024 Benzinga.com. Benzinga does not provide investment advice. All rights reserved.
Trade confidently with insights and alerts from analyst ratings, free reports and breaking news that affects the stocks you care about.

