


- The BTC/USD pays dearly for its bullish failure and shows its weaker side.
- The ETH/USD has more support lines and can hold up quite well, although it failed as well.
- The XRP/USD was the one that fired and hit the target, showing strength.
Yesterday, late in the European session, there was a price movement in one of the main protagonists of the Crypto board. Alerts were triggered with the XRP/USD rising very fast by more than 3.5 percent. Both the BTC/USD and the ETH/USD reacted to the rally, but it quickly became apparent that they were not invited to the party and promptly turned downwards.
The failed attempt took its toll, especially for the BCT/USD, which ended the day with some significant declines, reaching $6,250 for a few moments. The immediate reaction of the bulls returned him to the current narrow range, from where it seems to want to recover.
On the other hand, Ethereum just returned to the starting point but lost the support of the 50-period Exponential Moving Average.
The XRP/USD made it clear that it does not need to be accompanied to the podium by its mates. It went up and conquered $0.53, from where it seems, at least for now, to continue higher.
Do you want to know more about my technical setup?
BTC/USD 240-Min.
The BTC/USD is currently trading at the $6.286 price level. The mood for today is one of price declines, continuing the trend set yesterday after the failed uptrend.
The drop is underway, and technical analysis will help us detect the limits of the playing field.
Below the current price, the first support is at yesterday's lows of $6,250. This first support level will mark whether the BTC/USD continues to move sideways or if it is a trend move. The second support level is at $6,205 (price congestion support). At this price level, the fall suffered by the BTC/USD at the end of October was stopped. Losing this level would allow the BTC/USD to enter the medium-term relative lows of $6,150 and would safely raise the bulls' anxiety levels.
Above the current price, the first resistance to conquer is at the price level of $6,300. Right now, it is the level with more attraction capacity and little money entering the BTC/USD will be overcome.
The second resistance level is firm. In addition to the congestion resistance of the price at $6,360, right now the three major moving averages are concentrating on that exact spot. As if that wasn't enough, they do it on a downward cross trajectory, so they drag the sales with them. It is going to be very difficult to overcome if there is no bullish euphoria on the board.
The third level of resistance is at $6,495 (price congestion resistance).

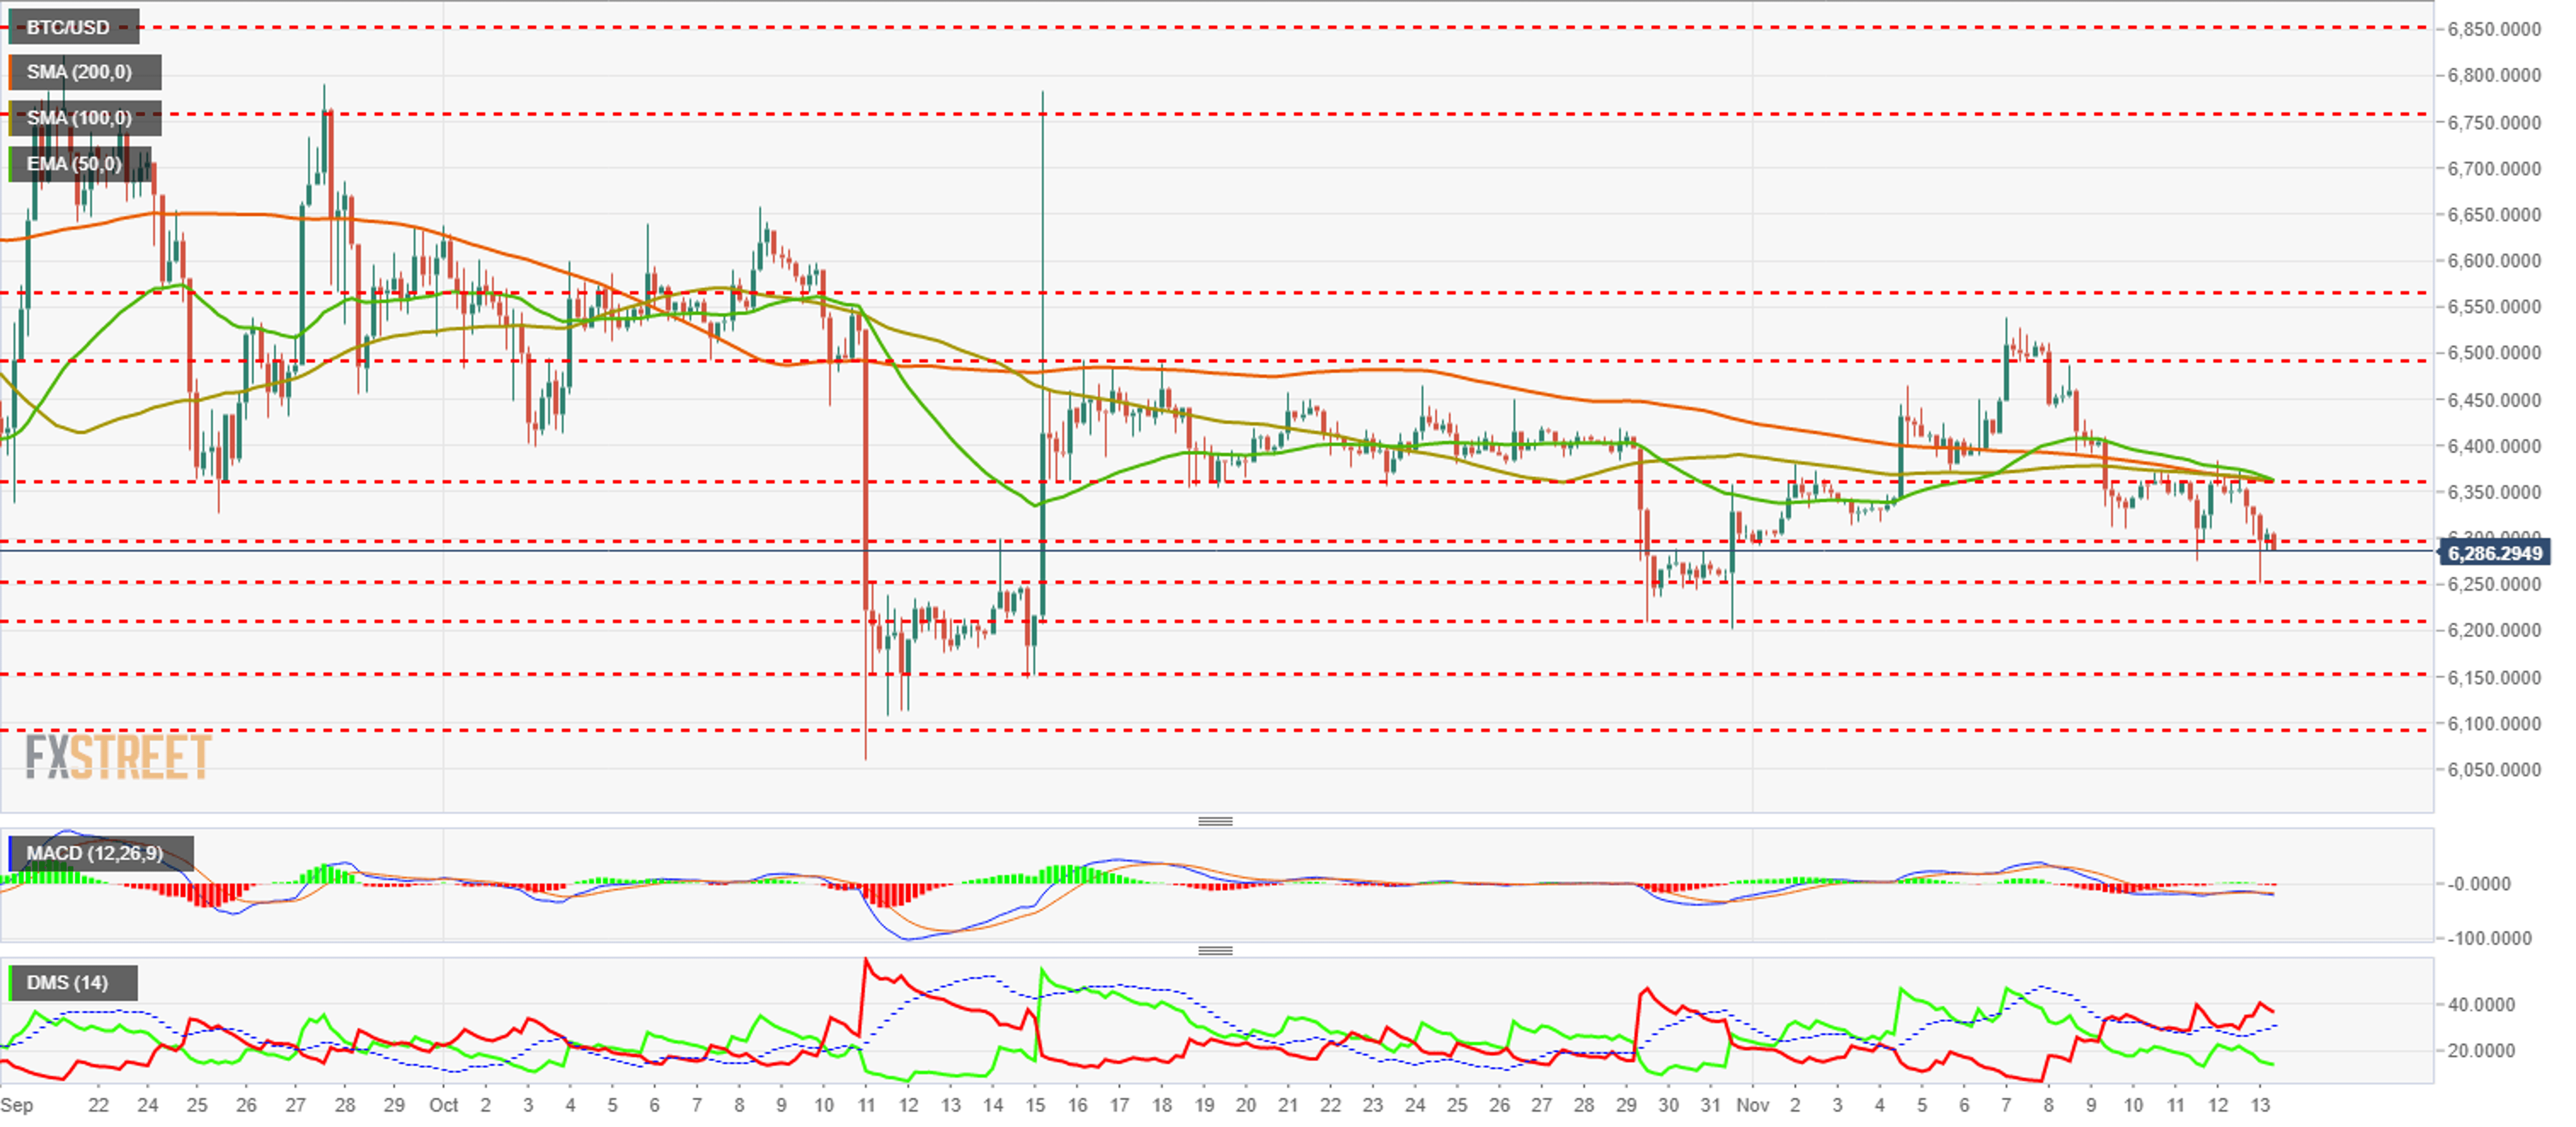
The MACD at 240-Minutes shows a cut-down profile without a line amplitude at this time. The pattern in the short term appears divergent, and a bullish turn would be reinforced.
The 240-Minute DMI shows that the bears are in control of the situation. They move freely above the ADX, which reacts to the rise and validates the movement. On the other hand, the bulls retreat and mark south direction.
ETH/USD 240-Min.
The ETH/USD is currently trading at the $207 price level. It also failed in its bullish attempt, but thanks to the support provided by the main moving averages may suffer less than the BTC/USD.
Below the current price, the first support at the price level of $206 (price congestion support). This support level is reinforced by the close presence of the 100 and 200-period Simple Moving Averages at the $207 and $204 price levels respectively. The second support is at $200, a psychological number that, if lost, can make the bulls nervous. If this level is not respected, a scenario would be opened where the third level of support at $194 would be within reach.
Above the current price, the first resistance in the Exponential Moving Average at $210. Conquering this level would give the ETH/USD much support for future price increases. The second resistance level at $215.25 (price congestion resistance). This resistance is an intermediate level to be able to face the third resistance at $223. This price level marks the relative maximum and surpassing it would open a scenario of fresh highs.

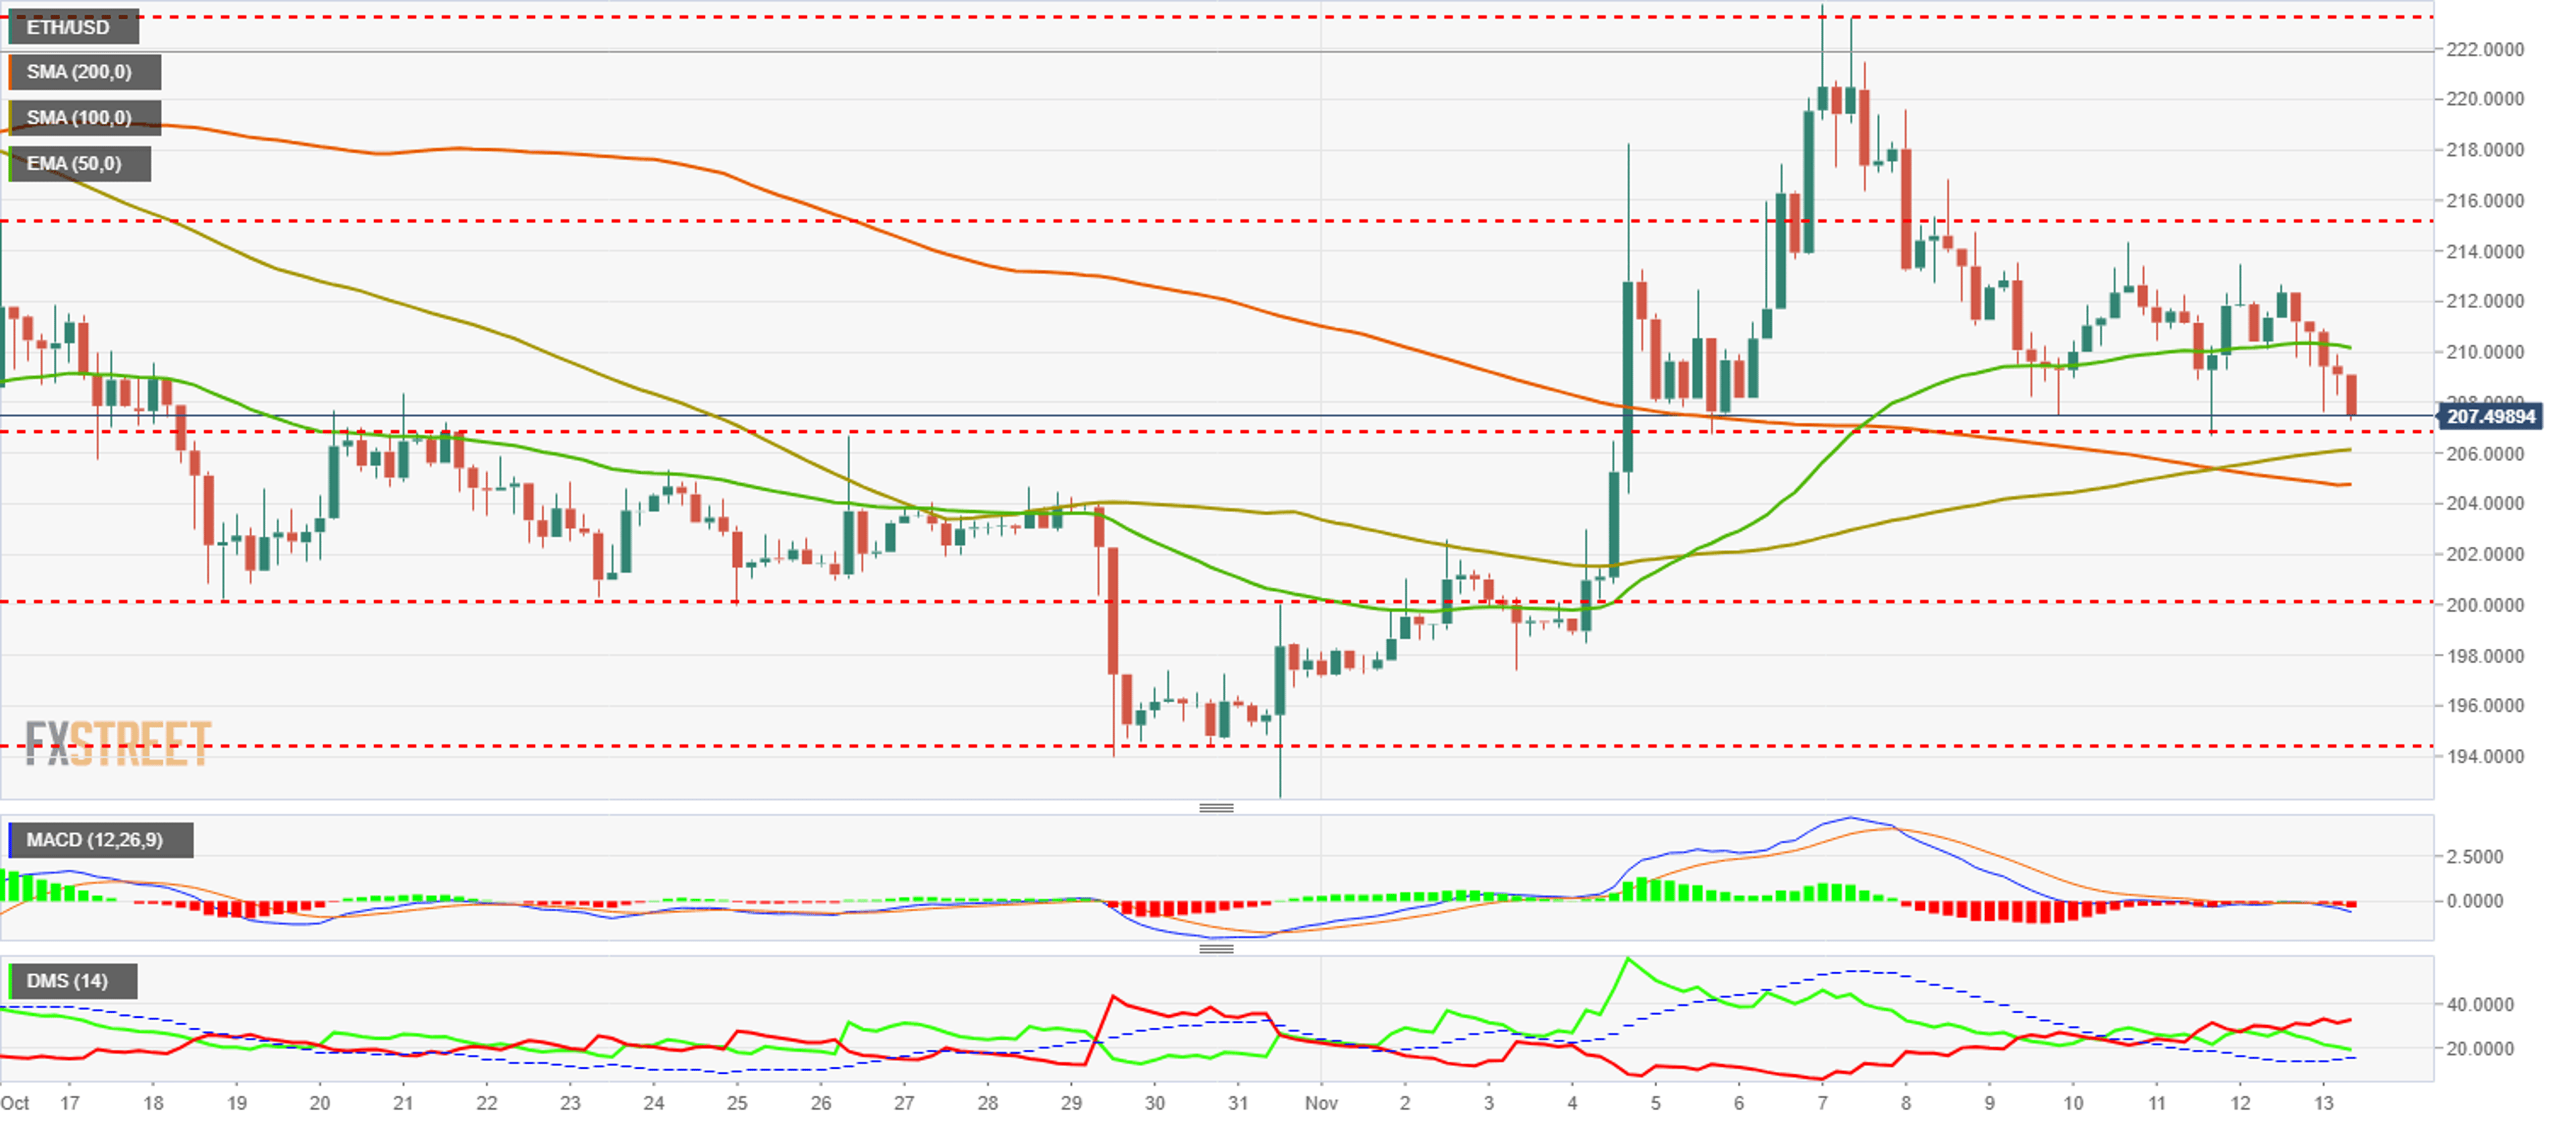
The MACD at 240-Minutes loses the support of the indicator's zero line and enters negative territory. It does not show a very aggressive profile, but we must watch in the next few hours. An increase of the inclination or an expansion of the separation between lines would announce us an acceleration of the falls.
The 240-Minute DMI shows us that the bears taking control of the situation. They are clearly on an upward trajectory, and it appears that the ADX accompanies the bearish trend. On the other hand, the bulls withdraw without sinking as they do in the case of the BTC/USD.
XRP/USD 240-Min.
The XRP/USD is currently trading at the $0.519 price level. It has made an upward move early in the morning, but it appears that the falls in Bitcoin and Ethereum are curbing Ripple’s energy. In any case, it doesn't present a low profile similar to that of its colleagues, as explained earlier.
Above the current price, the first resistance is at $0.547 (price congestion resistance). Exceeding this relative maximum level would confirm the development of another bullish wave. The target for this move is the second resistance at $0.585.
Given the historical volatility of the XRP/USD when it starts in third place, I indicate that the target of the move should be higher than the relative maximum by $0.766.
Below the current price, the first support is at $0.505 (price congestion resistance and EMA50). The second support is three related levels between them. The first is $0.483 (SMA110) followed by the trend line that governs the movement at $0.475 and, as the third member of the triad, the SMA200 at the price level of $0.467.

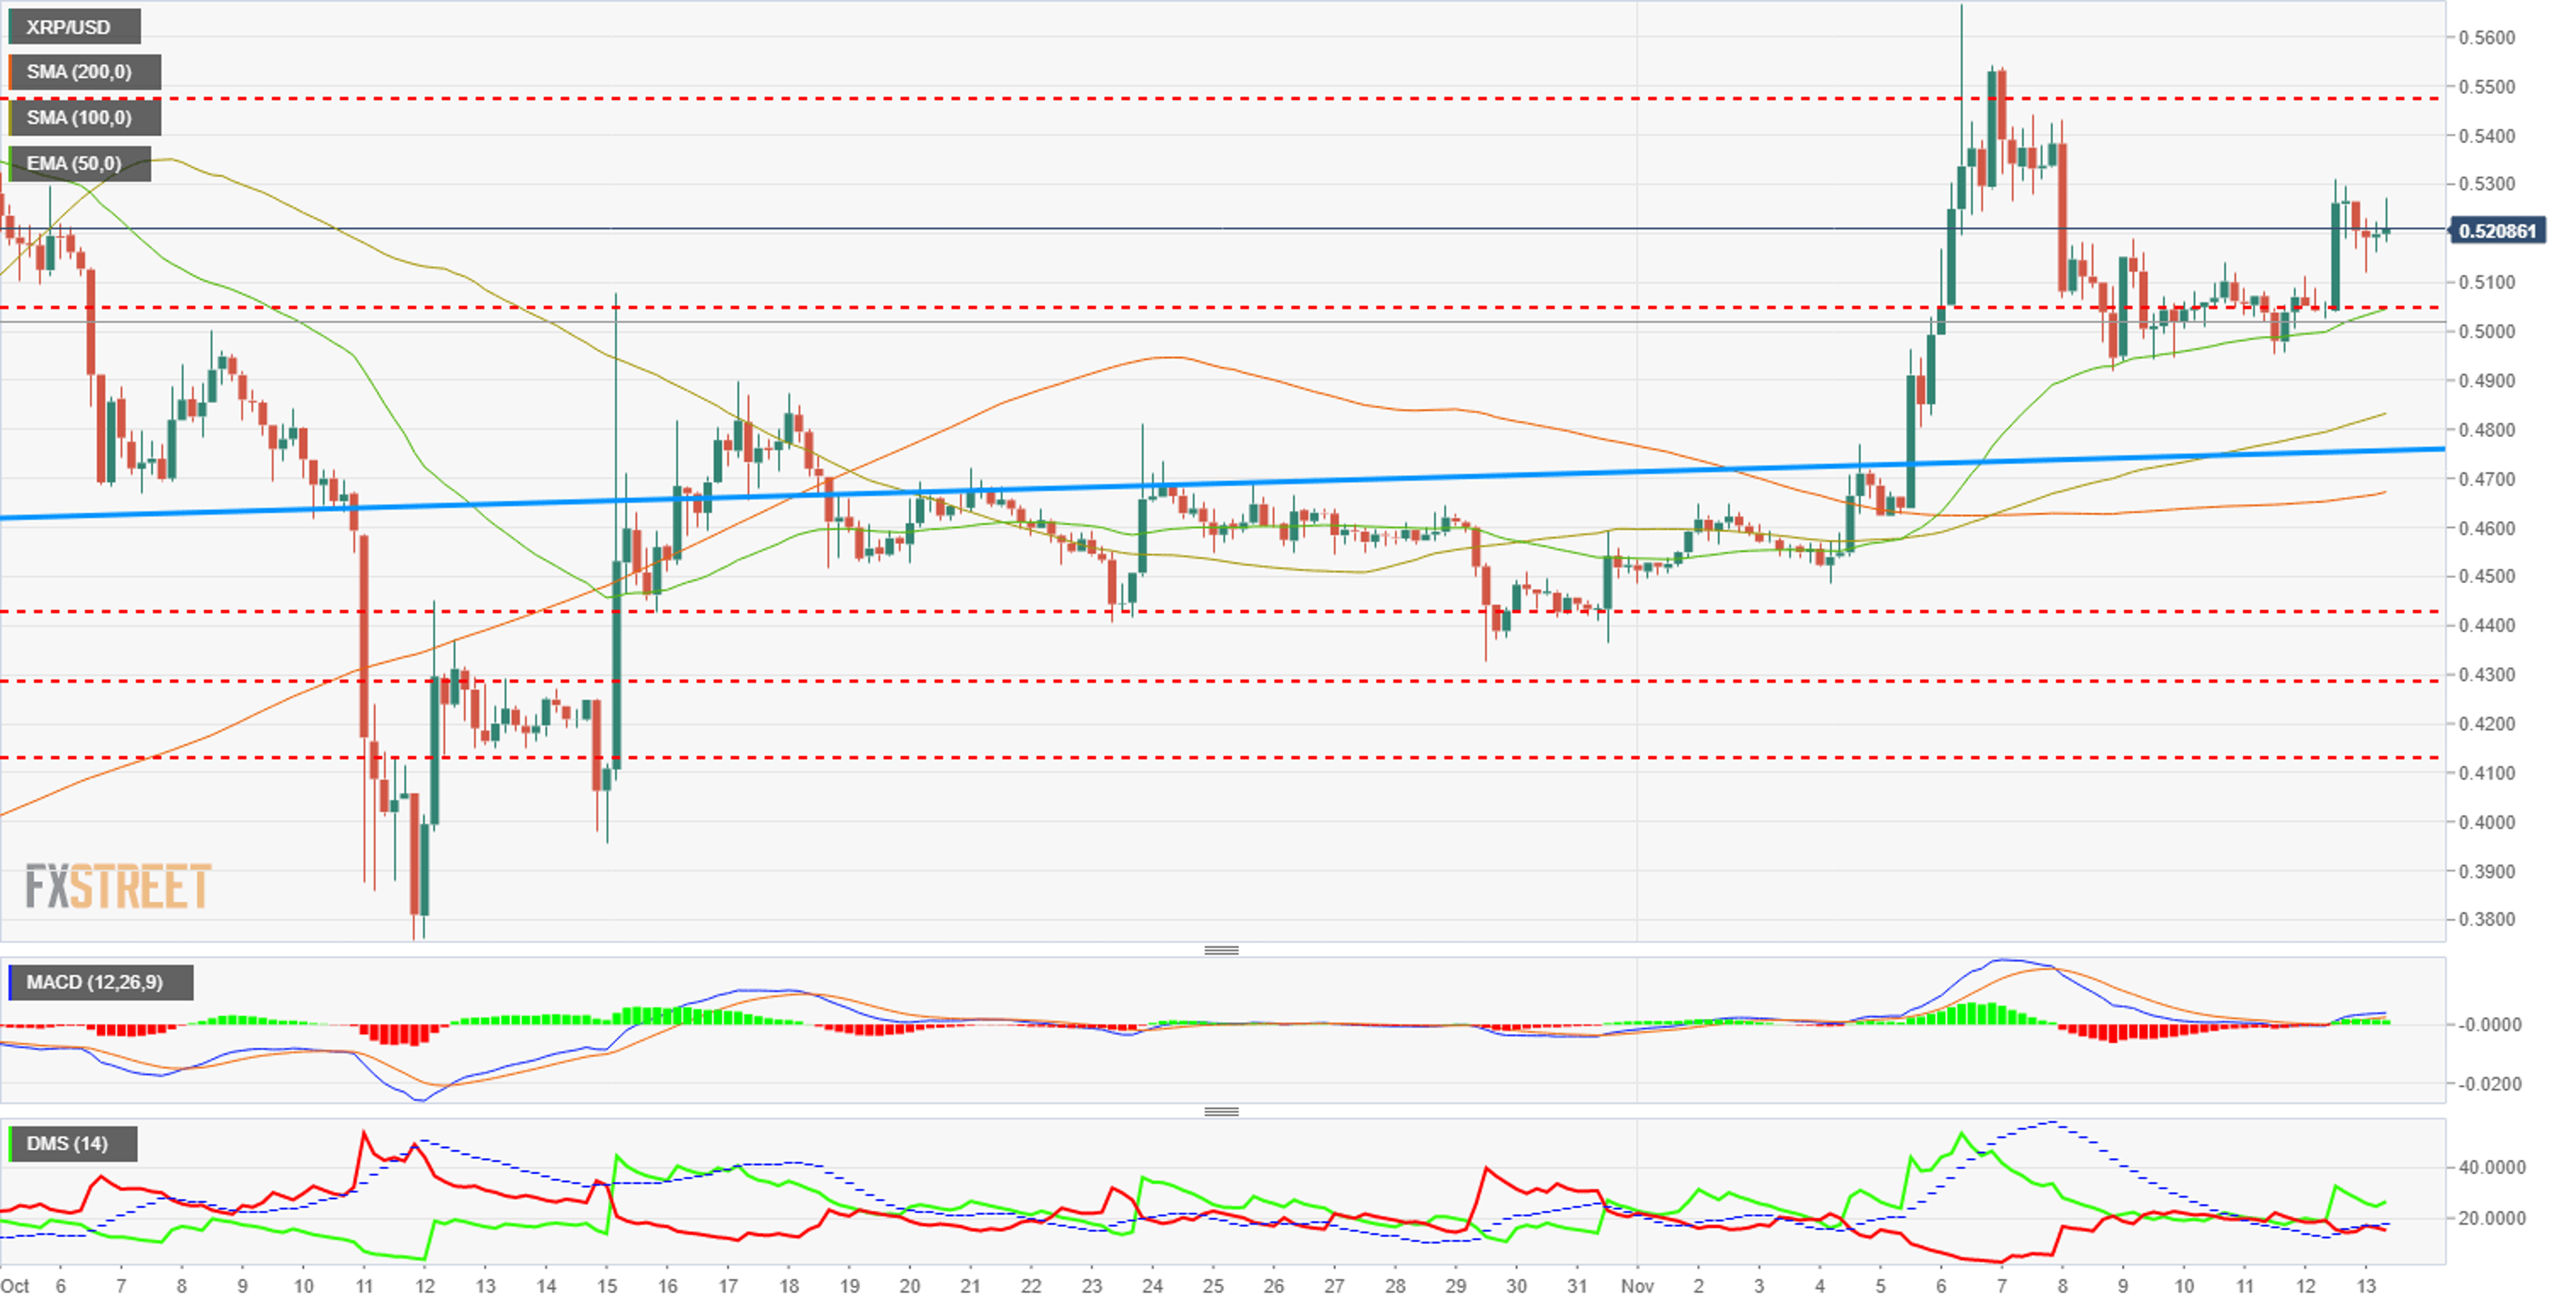
The MACD at 240-Minutes shows a cross profile above the neutral line of the indicator. In principle it is positive, but it needs to develop a little more to be able to express the real potential of the movement.
The DMI at 240-Minutes shows us the bulls with control of the situation but in an incipient way. They need to reaffirm the upward trend. ADX timidly accompanies the upward movement. The bears, on the other hand, remain at shallow levels and do not seem to have any intention of fighting for leadership.
Get 24/7 Crypto updates in our social media channels: Give us a follow at @FXSCrypto and our FXStreet Crypto Trading Telegram channel
© 2024 Benzinga.com. Benzinga does not provide investment advice. All rights reserved.
Trade confidently with insights and alerts from analyst ratings, free reports and breaking news that affects the stocks you care about.

