


- BTC/USD shows signs of depletion in the short term.
- ETH/USD is at a crossroad and this is no time to think but to act.
- XRP/USD must attack or rest as the current position may be a waste of energy.
We start the month of October with the main actors of the Crypto board in the same price range in which they have traded in for more than a week. Bitcoin and Ethereum are compressed between the moving averages in 4H charts. Ripple enjoys freedom in that sense, but the trend line coming from annual lows is proving to be powerful and technically significant.
Preliminary analysis points to possible falls today. Attention is again focused on the ETH/BTC, which has passed the accelerated trendline and has an important technical situation ahead of it. A bullish escape can carry the entire Altcoin market to higher levels. If, on the other hand, it begins to slide towards lower levels, we may have some bearish sessions ahead of us.
BTC/USD 240-Min
The BTC/USD is currently trading at the $6,597 price level, just below the SMA200 and closely supported by the EMA50 and the SMA100.
Below the current price, the first support for the BTC/USD is at $6.564. A drop below this level technically opens the possibility of falls with a target of $6,450. This is not an easy scenario as the SMA100 is in the middle at $6,257, which can generate volatility within this narrow price range. The fall could be extended in a second step up to $6,390 as a precursor to a higher range movement that would look for the trend line that has its origin in the annual lows and that currently passes for $6,200.
Above the current price, the first requirement to see an upward movement in the BCT/USD is to exceed the SMA200 at $6.625. If this key moving average can be surpassed, the BTC/USD is presented with relative highs of $6.764.4 as its main objective. If this occurs, the main objective would move to $7,100 with only one intermediate hurdle at $6,851.


The MACD at 240-Min continues with a very horizontal profile that makes it very difficult to propose anything for the next periods. It seems to invite further downward movements, which should be small given the support that the zero line can provide.
The DMI to 240-Min shows us bears with a very small advantage over bulls, so small that it can change at any time. The level reached by the ADX marking a squalid 9.27 is very remarkable, a minimum level that was seen only twice in the last six months. Both bears and bulls move above level 20, in a bloodless battle to gain distance with the other side of the market and take the ADX to their terrain.
ETH/USD 240-Min
The ETH/USD is in a very similar technical situation. The differences are seen in the MACD, with more inclination and a clear bearish cut profile. Also in the DMI we can see differences, with an ADX that indicates that the activity in the ETH/USD is maintained at acceptable levels and conserves inertia in the exchange of prices.
Below the current price, a bearish signal would appear below the $223 price level, where the EMA50 and the SMA100 converge and it is also a key level of price congestion. The first target for the ETH/USD on the downside is at $195 with a Stop at $240. An acceleration of the bearish momentum could widen the range of declines and move the bearish target to a lower level at $170.
Above the current price, we note a bullish signal above the $240 price level. To reach this level, the ETH/USD will have to exceed the SMA200 by $232 in the first place and face $250 at last week's highs. If it exceeds these relative highs it should move smoothly to the $270 price level.


The MACD at 240-Min shows us a clearly inclined profile downwards and with many possibilities of being cut in favor of bears. The nearness of the zero line as support can contain the falls if they finally appear.
The 240-Min DMI shows an absolute tie between bears and bulls. Both are seen above the indicator at level 20 so both sides of the market have the potential to accelerate.
The ADX stays slightly below the signal level of 20 and increases the chances of a rapid acceleration of any movement.
XRP/USD 240-Min
The XRP/USD enjoys a seemingly cleaner and clearer stage than those with Bitcoin and Ether. It moves well above moving averages. Perhaps it's too much price deviation and the Ripple develops a pattern of movement back to the moving averages.
Below the current price, the bearish signal appears below the EMA50 at the price level of $0.53 with a Stop above $0.55. The primary target is $0.46, just above the SMA100 and two important trendlines. There is no margin for further declines if we shake up the current bullish scenario which should be rethought in a more bearish way.
Above the current price, the barrier is at $0.644 where a trendline passes that governs the price from annual lows. Placing oneself above it would accelerate the upside movement in the price. Up to that level, two lower resistances await at $0.60 and $0.63.
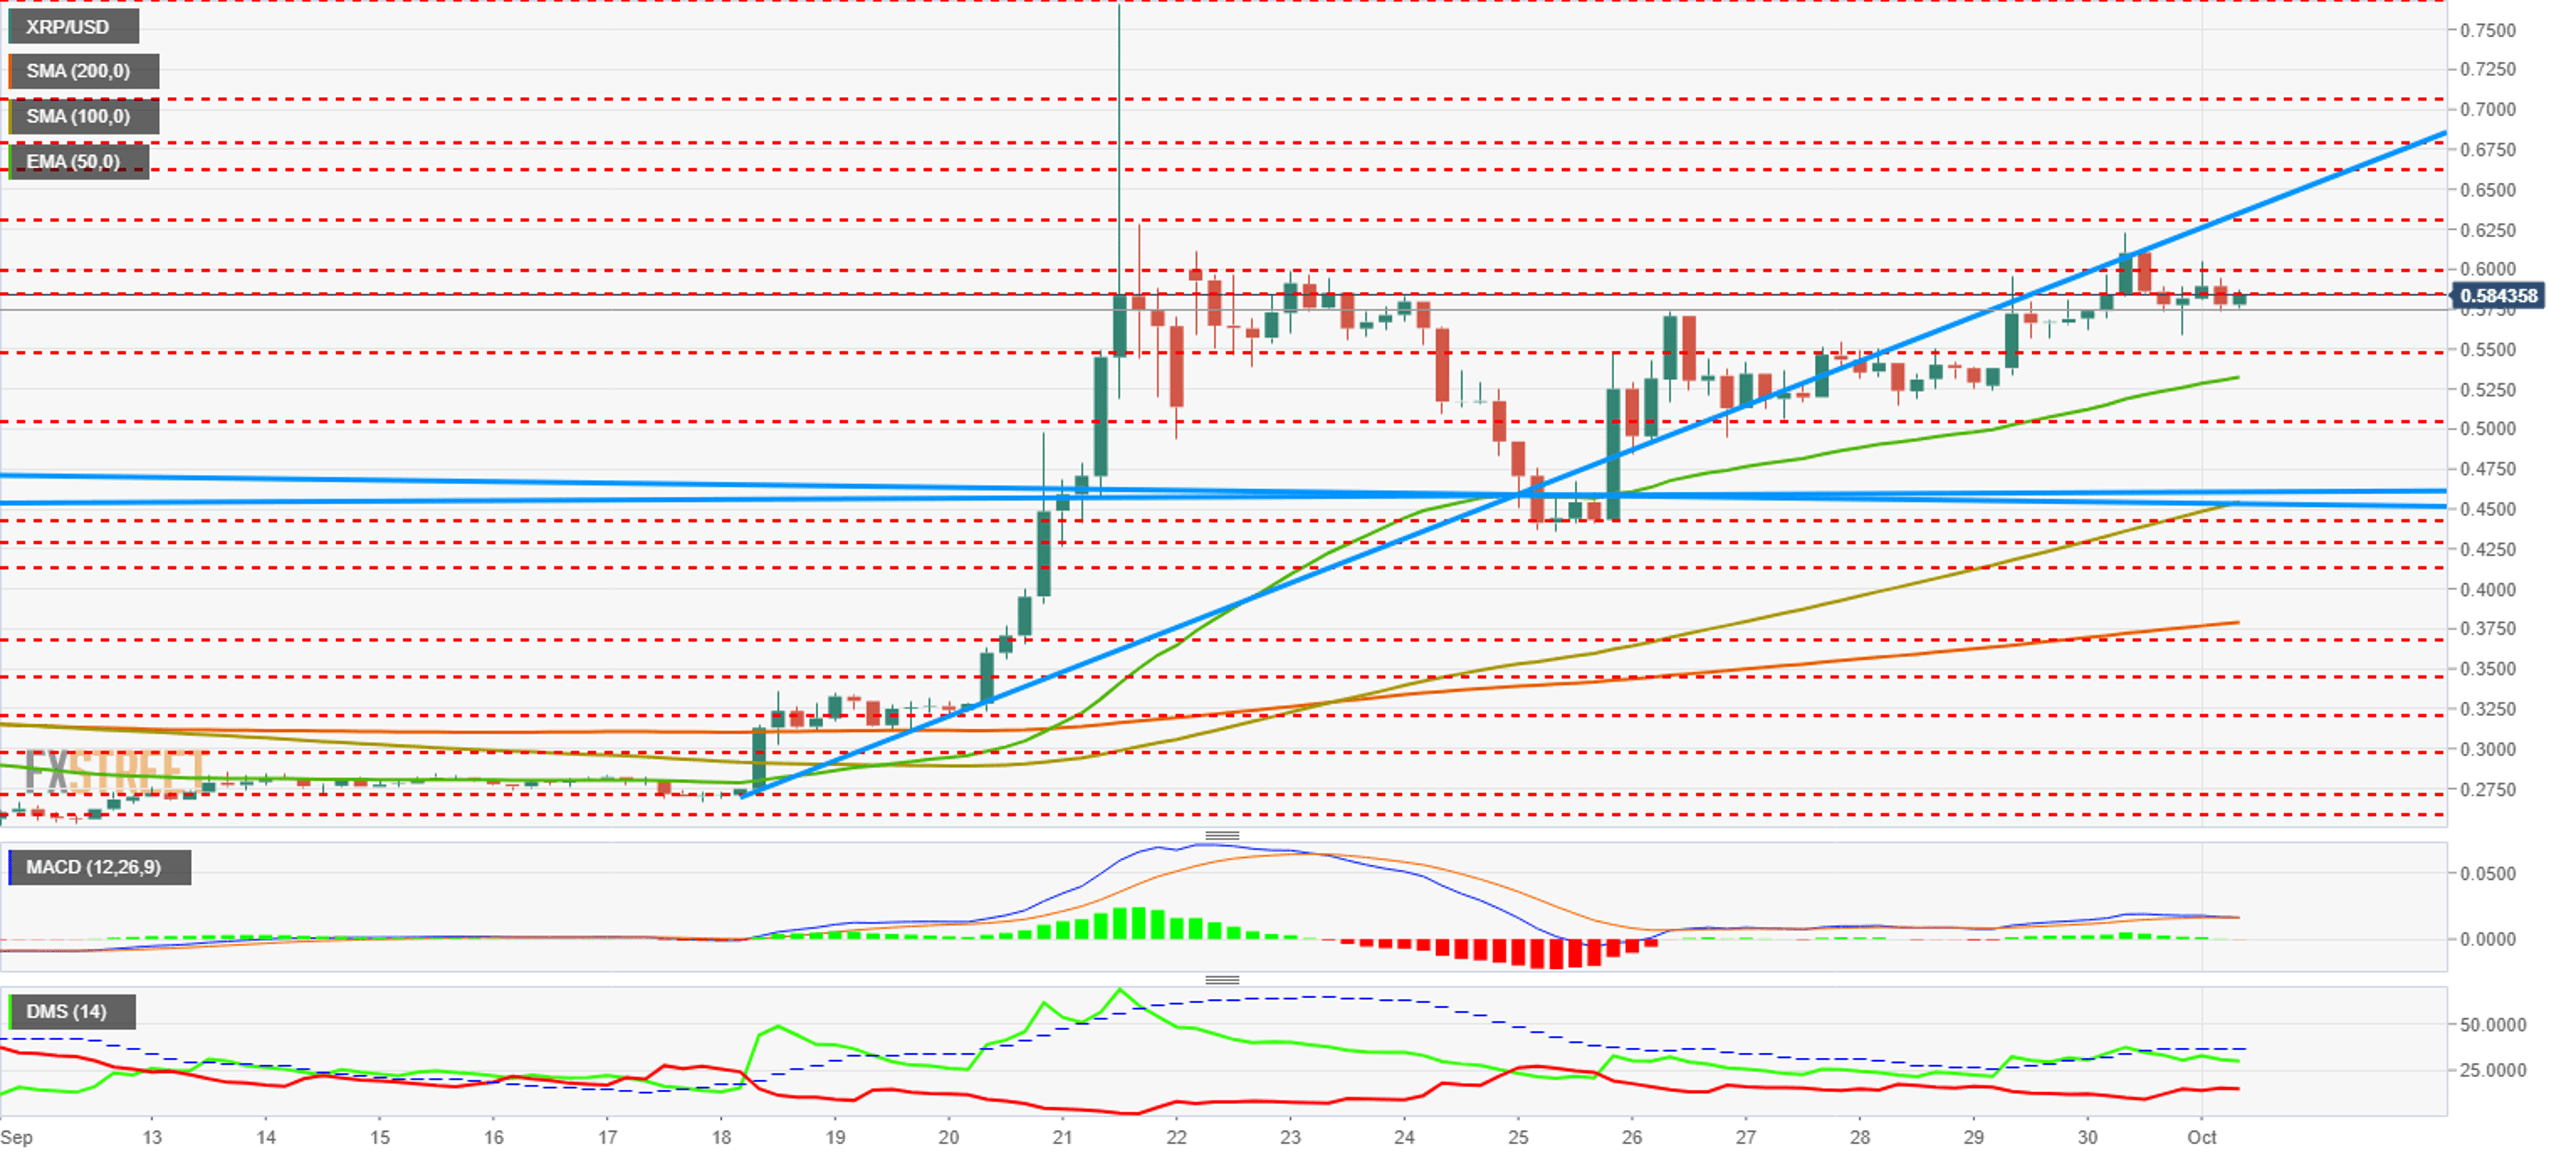
The MACD at 240-Min shows us a horizontal profile although slightly inclined downwards. The indicator has traveled to reach the zero line. So, to appreciate the falls, it can have a certain magnitude.
The DMI at 240-Min shows the bulls dominating the situation. They have barely withdrawn despite the stagnation of the price and continue to bet on the increases. On the other hand, bears are more active and seem to believe in possible price decreases. The ADX remains at high levels and would bring acceleration to any movement in the XRP/USD.
Get 24/7 Crypto updates in our social media channels: Give us a follow at @FXSCrypto and our FXStreet Crypto Trading Telegram channel
© 2024 Benzinga.com. Benzinga does not provide investment advice. All rights reserved.
Trade confidently with insights and alerts from analyst ratings, free reports and breaking news that affects the stocks you care about.

