


We will start this week’s post with Bitcoin. There has been some chatter in media that the recent plunge in Bitcoin influenced or helped set off the sharp drop in the equity indices, and the recent rally in cryptocurrencies has helped to stabilize equities. There certainly are some similarities in the recent price action, but Bitcoin is still not an institutionally traded product to a large degree. On the retail side, however, there are a few things to consider from recent movements and going forward, including sentiment. There was definitely a significant amount of froth in the crypto markets after its meteoric rise in 2017, especially in Q4. When retail investors left Bitcoin in 2018, retail money flowed into stocks of all sectors and the S&P became very frothy.
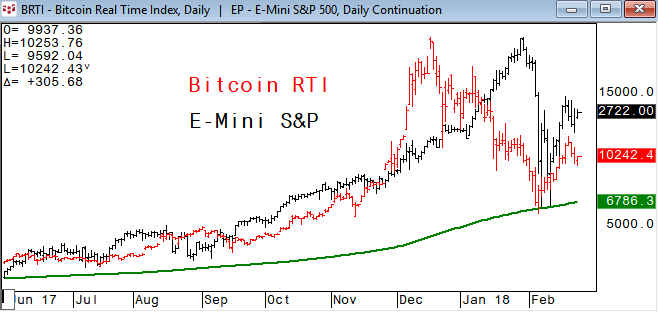
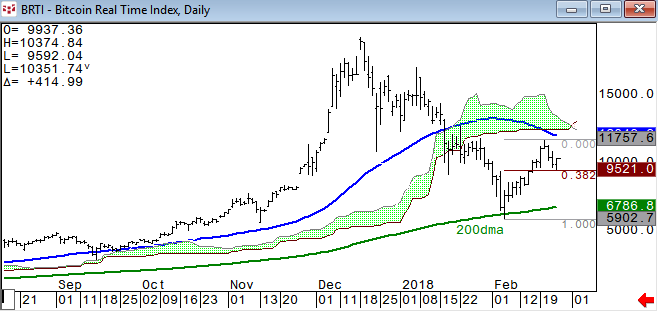
From January 4th until January 29th, the SPDR S&P 500 ETF Trust SPY set a record for its relative strength indicator (RSI) with 18 straight days above 75 (overbought or seen as unsustainable). Of course the inverse VIX or volatility crisis crushed stocks violently, but this exuberance could have been the spark. Both the Bitcoin Real Time Index and E-Mini S&P futures hit their respective 200-day moving average on the same day,February 6th (see chart above). The equity market remained vulnerable until SPY gave the 200dma a try on February 9th (see chart below). From these lows BRTI has rallied +99%, and SPY has gained +8.8% on its recent high. Both have some key resistance to be aware of.
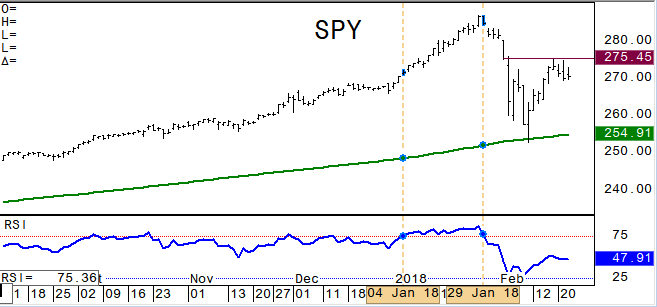
SPY has the February 2nd settlement (beginning of vol crisis) as its likely pivotal resistance area for now. BRTI has its 50 day moving average and cloud resistance as key. It is probably healthy for Bitcoin to see some consolidation and less volatility as more institutional traders consider the space.For now, we will use the 9520 area as short-term support.
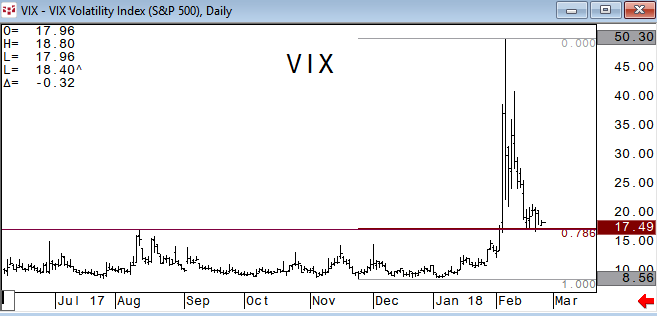
The VIX has come in significantly and even had a brief dip back below 17 ahead of the FOMC minutes this week. But, holding above it for now as volatility and two sided trade is likely here to stay for a while.
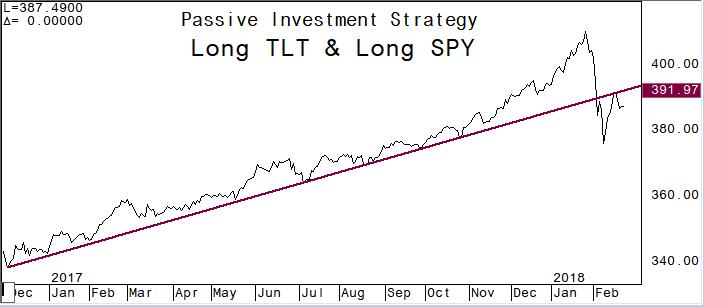
This is my overall gauge of the markets: The long iShares Barclays 20+ Yr Treas.Bond TLT and long SPY trade (which is a version of the passive investment strategy). With the Fed looking to raise rates three times this year, equity traders have one eye glued on the long bond and longer duration fixed income products. If TLT + SPY can climb back above the broken trend line it would be a positive signal for passive investors. So far it is holding below this line and remains vulnerable.
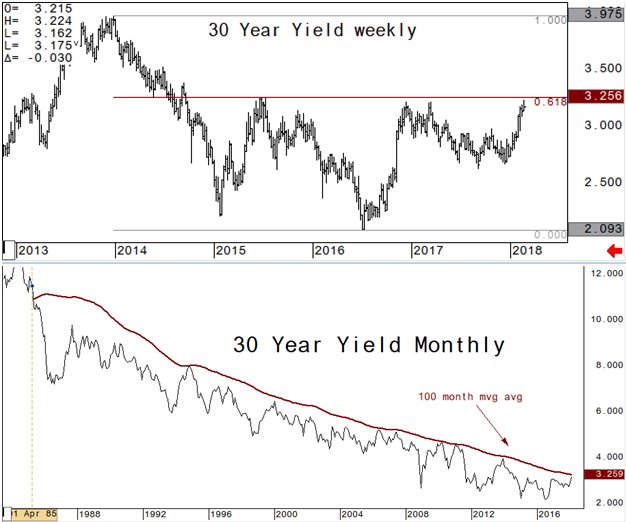
Everyone has the 3% level in 10-year yield as a major key to watch, but I want to show the 30-year yield. 3.25% has major technical significance as it is a .618 Fibonacci retracement level and the 100 month moving average which 30-year yield has held below since April 1985. This long-term moving average has also had many attempts and failures around it. What happens once this level is broken will likely be significant to equities.
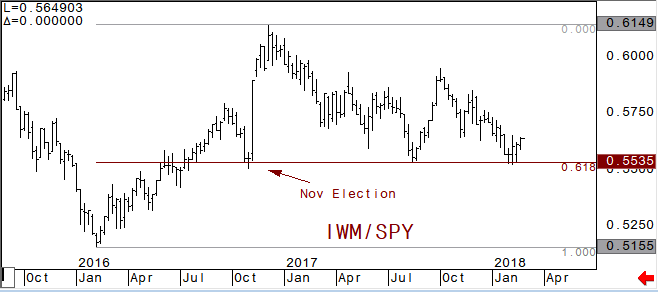
This chart of iShares Russell 2000 Index IWM vs SPY shows positive signs for the overall equity market. The .618 retracement here has several significant touches and a break here would see small caps underperforming while breaking a pivotal support. This is the level that the ratio ramped higher on the US Presidential election, held on the August slide in equities due to North Korea concerns, and has been holding again for all of 2018. Normally we would look for small caps to lead the overall market lower during a real correction.
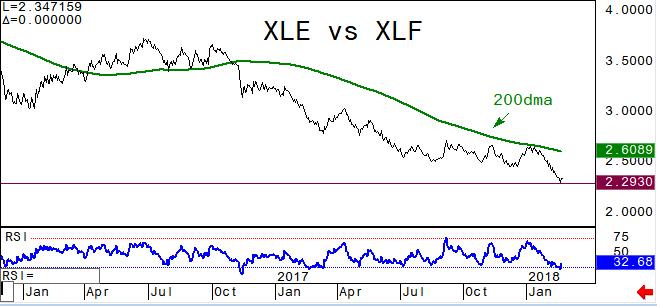
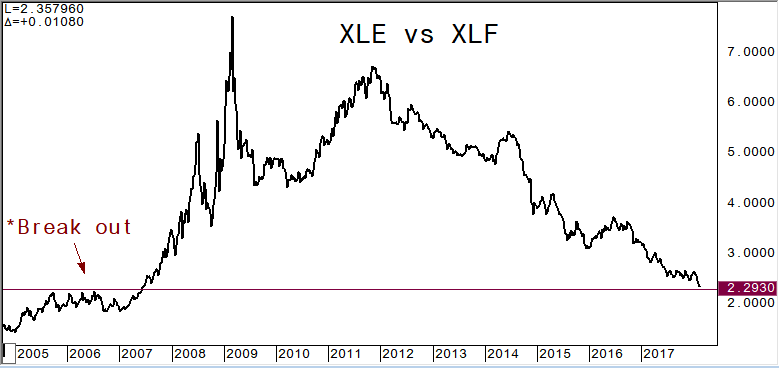
Rotation: high correlations between the major sectors in the S&P 500 were another signal that things were becoming unsustainable in January. With high correlations there is simply nowhere to hide when the market starts to turn lower. We are starting to see some rotational plays in the last couple of weeks, which would be a positive signal overall for the market. One key pair to keep an eye on is the energy and financial sector ETFs. Energy was a huge underperformer for the first half of 2017 and then money flowed into energy XLE rallied +26.8% from its August low to January high). Energy took it on the chin during the recent decline, as XLE fell -17.8%. From a technical standpoint being short XLE versus long Financial Select Sector SPDR Fund XLF (or rotate out of energy and into financials) made sense as the 200dma in the pair was resisting in early January. Currently, momentum is very depressed here, and energy should be able to outperform for a bit as the long-term view shows this is about where XLE/XLF based and had a breakout in 2007.
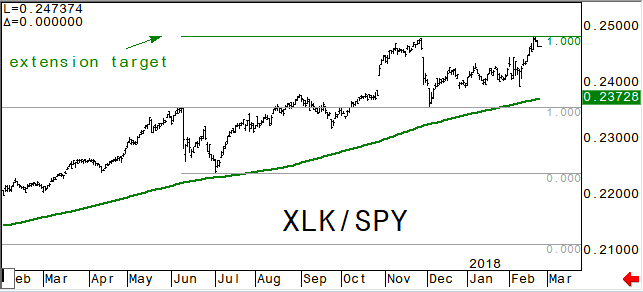
Technology sector XLK) has been an overall leader again this year, and here we look at XLK relative to SPY. If tech starts to pullback it may not be a signal for the overall market if it is part of rotation into something else. XLK/SPY hit its extension target this week as SPY catches up a bit.
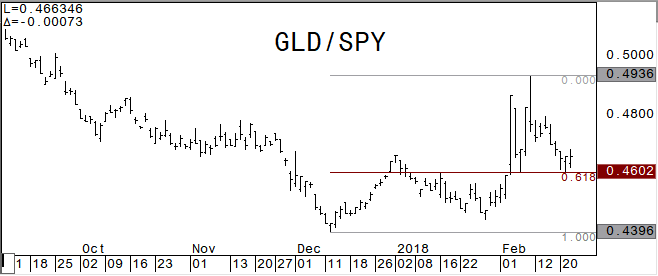
Gold has been vulnerable this week as the dollar firms. Continued dollar strength may see rotation out of gold and gold stock, But the US$ Index has some room before it would test a pivotal resistance. For now, we are watching GLD vs SPY as it holds a short term .618 retracement area that seems pivotal. A clean break of this Fibonacci level would see gold underperform and the potential for rotation out of gold.
In conclusion, we need to keep an eye on the dollar and any rhetoric that may lead to a sharp move there. On days where the market is falling, look to see if there are some sectors that are seeing flows into them. Rotation has been a positive overall. And keep an eye on Bitcoin. It may not be the sentiment indicator that VIX is, but it can be a gauge for retail investors appetite for risk…
David Wienke is the editor of Keystone Charts. More than 30 years of experience providing technical analysis and execution services to institutional clients is now provided in a daily newsletter, The Daily Game Plan. Coverage includes equities, rates, currencies, and commodities. Dave is also an introducing broker with Capital Trading Group, LLLP (CTG); a Chicago based investment firm focusing on alternative investment opportunities for CTAs and individual investors. Charts are created using CQG, the best charting service there is. For a free trial of the Daily Game Plan newsletter go to www.keystonecharts.net, email me at dave@keystonecharts.net or go to Capital Trading Group to subscribe.
Charting by CQG
DISCLAIMER: For Educational purposes only. This is not a solicitation to buy or sell commodity futures or options on commodity futures and should not be construed as such. Although care has been taken to assure the accuracy, completeness and reliability of the information contained herein, Keystone Charts, Inc. makes no warranty, expressed or implied, or assumes any legal liability or responsibility for the accuracy, completeness, reliability or usefulness of any information, product, service or process disclosed.
© 2024 Benzinga.com. Benzinga does not provide investment advice. All rights reserved.
Trade confidently with insights and alerts from analyst ratings, free reports and breaking news that affects the stocks you care about.

