


There are only three things that a stock or index can do: go up, go down, or go sideways. Traders need to know how to manage up-trends and downtrends, and more importantly, how to identify a change in trends.
Those who are long at a market top or short at a market bottom need to know when to exit their trades. Profits can be erased in the blink of an eye when the market’s trajectory turns. But those who anticipate those turns can enjoy enormous gains.
Take the S&P 500 chart below as an example.

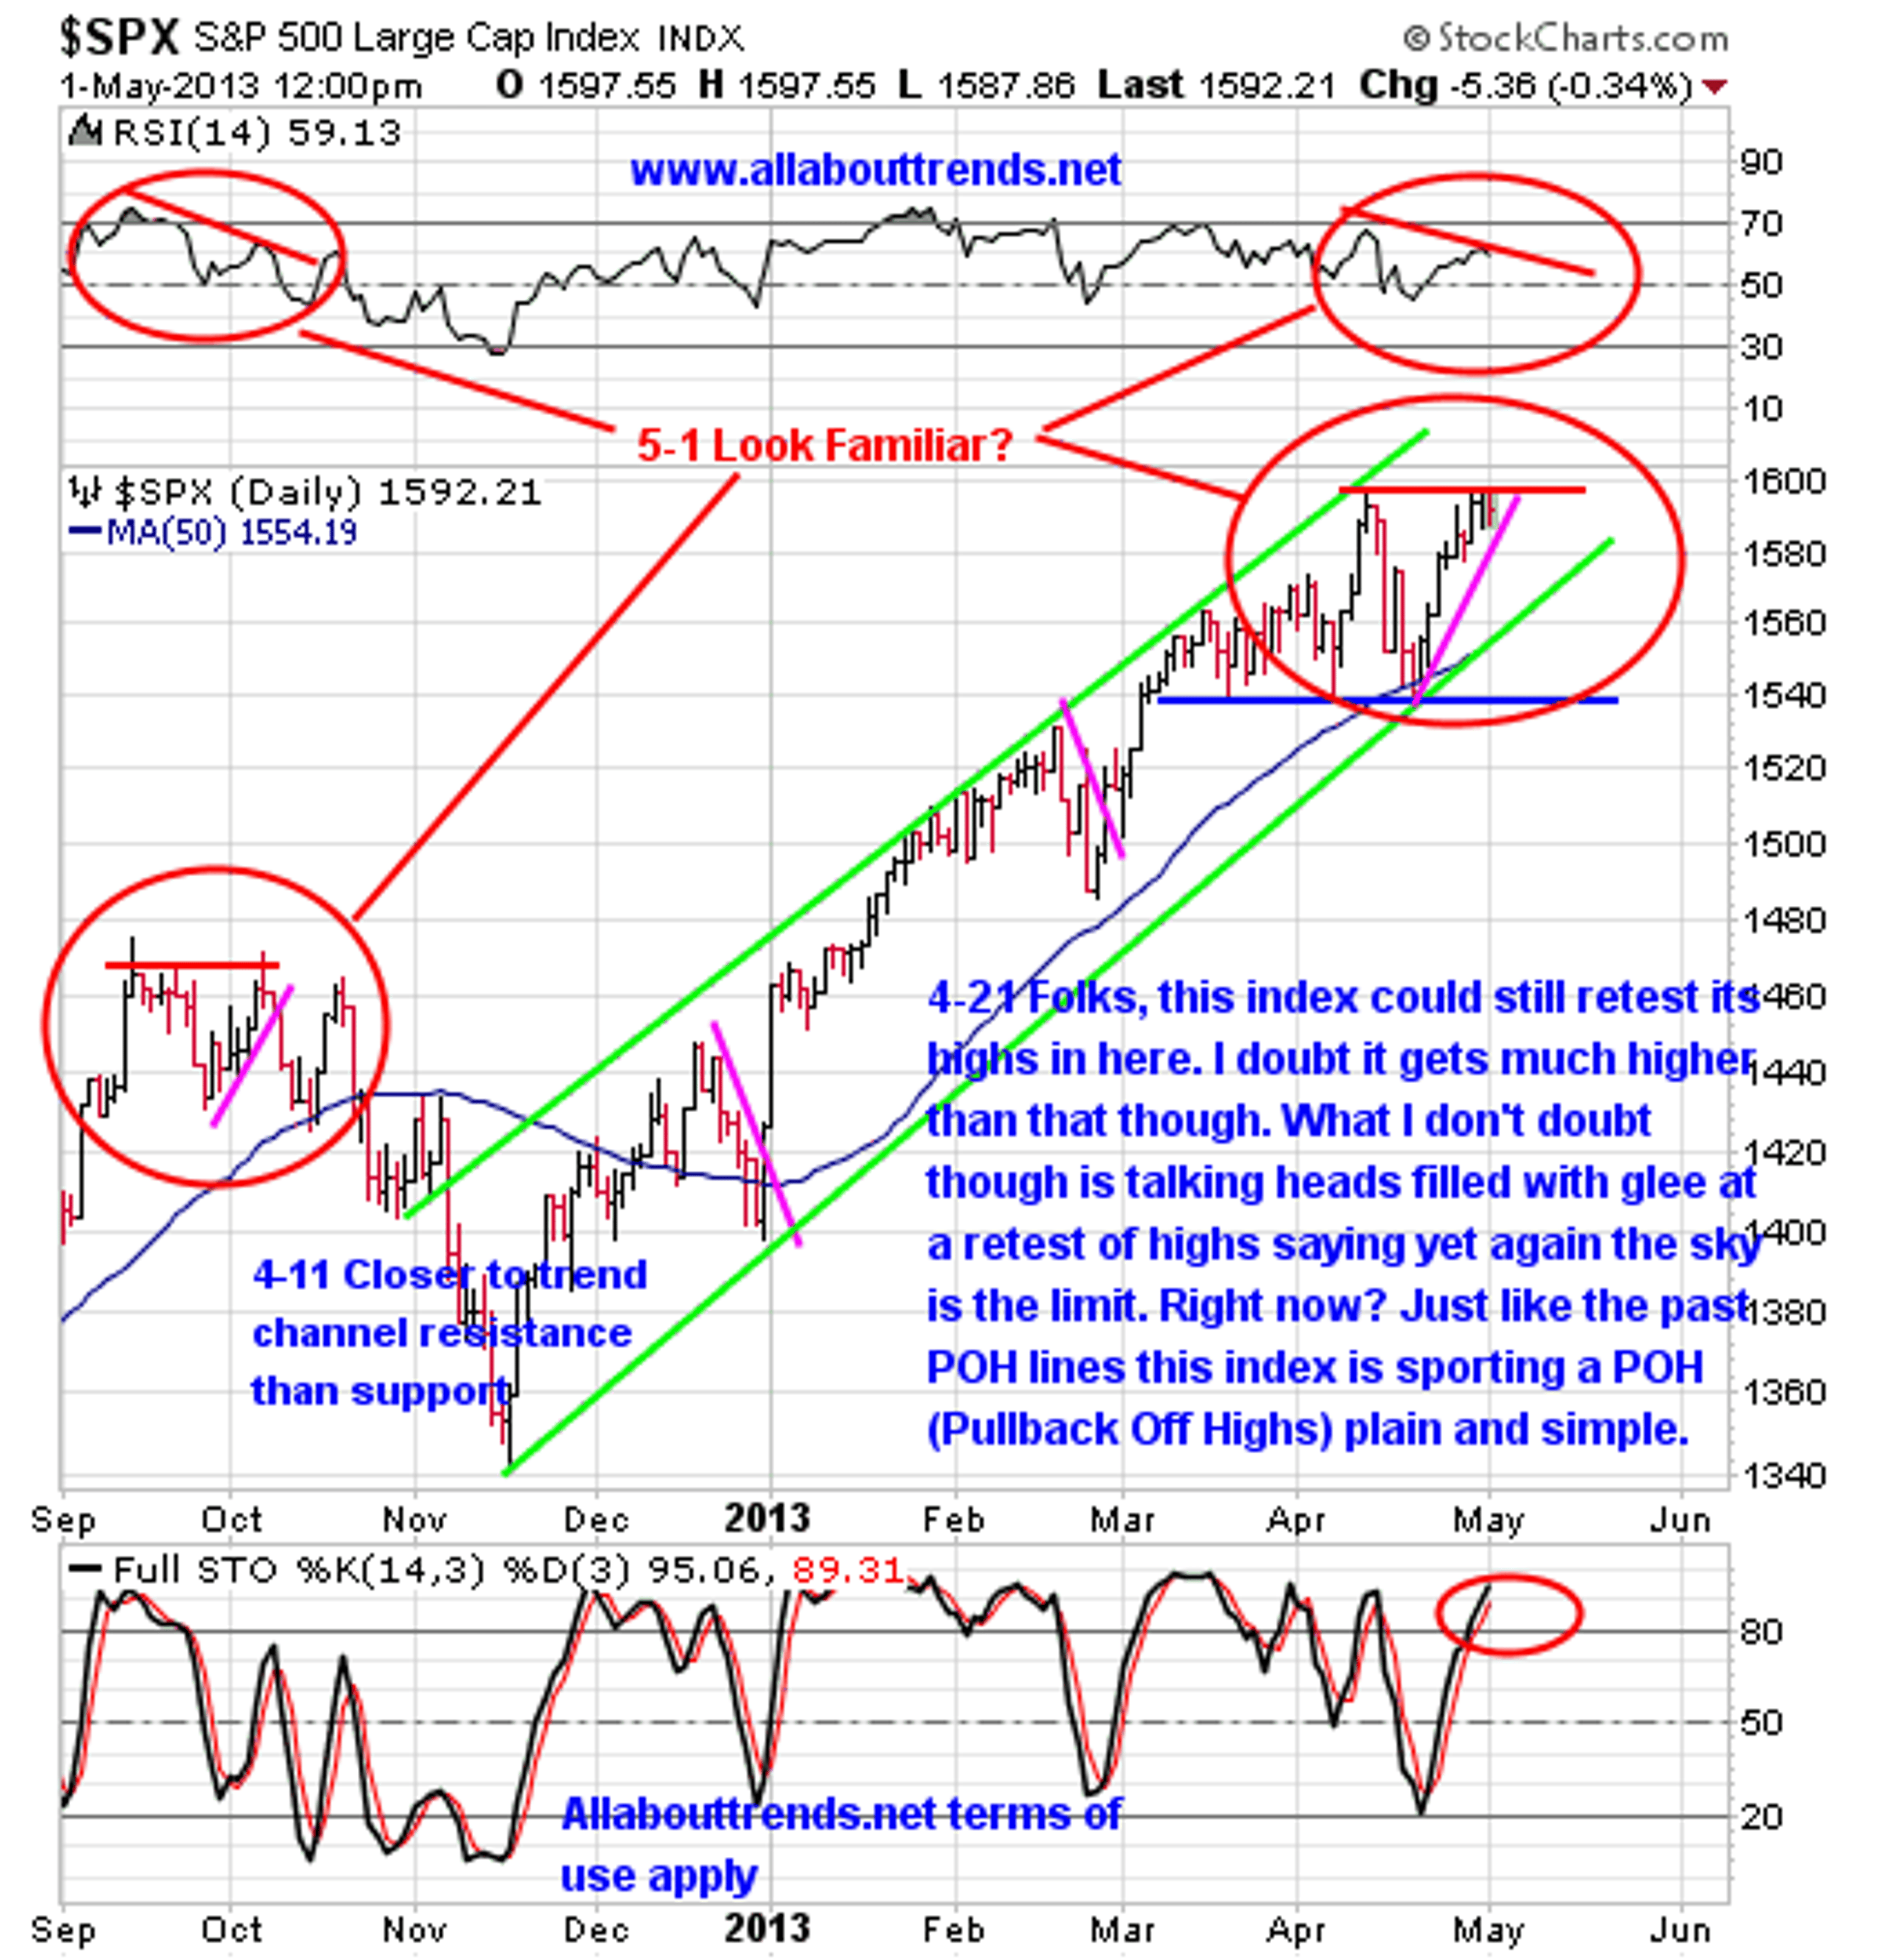
The chart for the beginning of October 2012 and May 2013 look eerily similar. Technical analysts watch, with well-trained eyes, for the market’s repeating patterns. Traders should be concerned that the market could see a re-run of the bear run from last October.
To drive the point home, observe the patterns in this S&P 500 chart from the past 16 years.
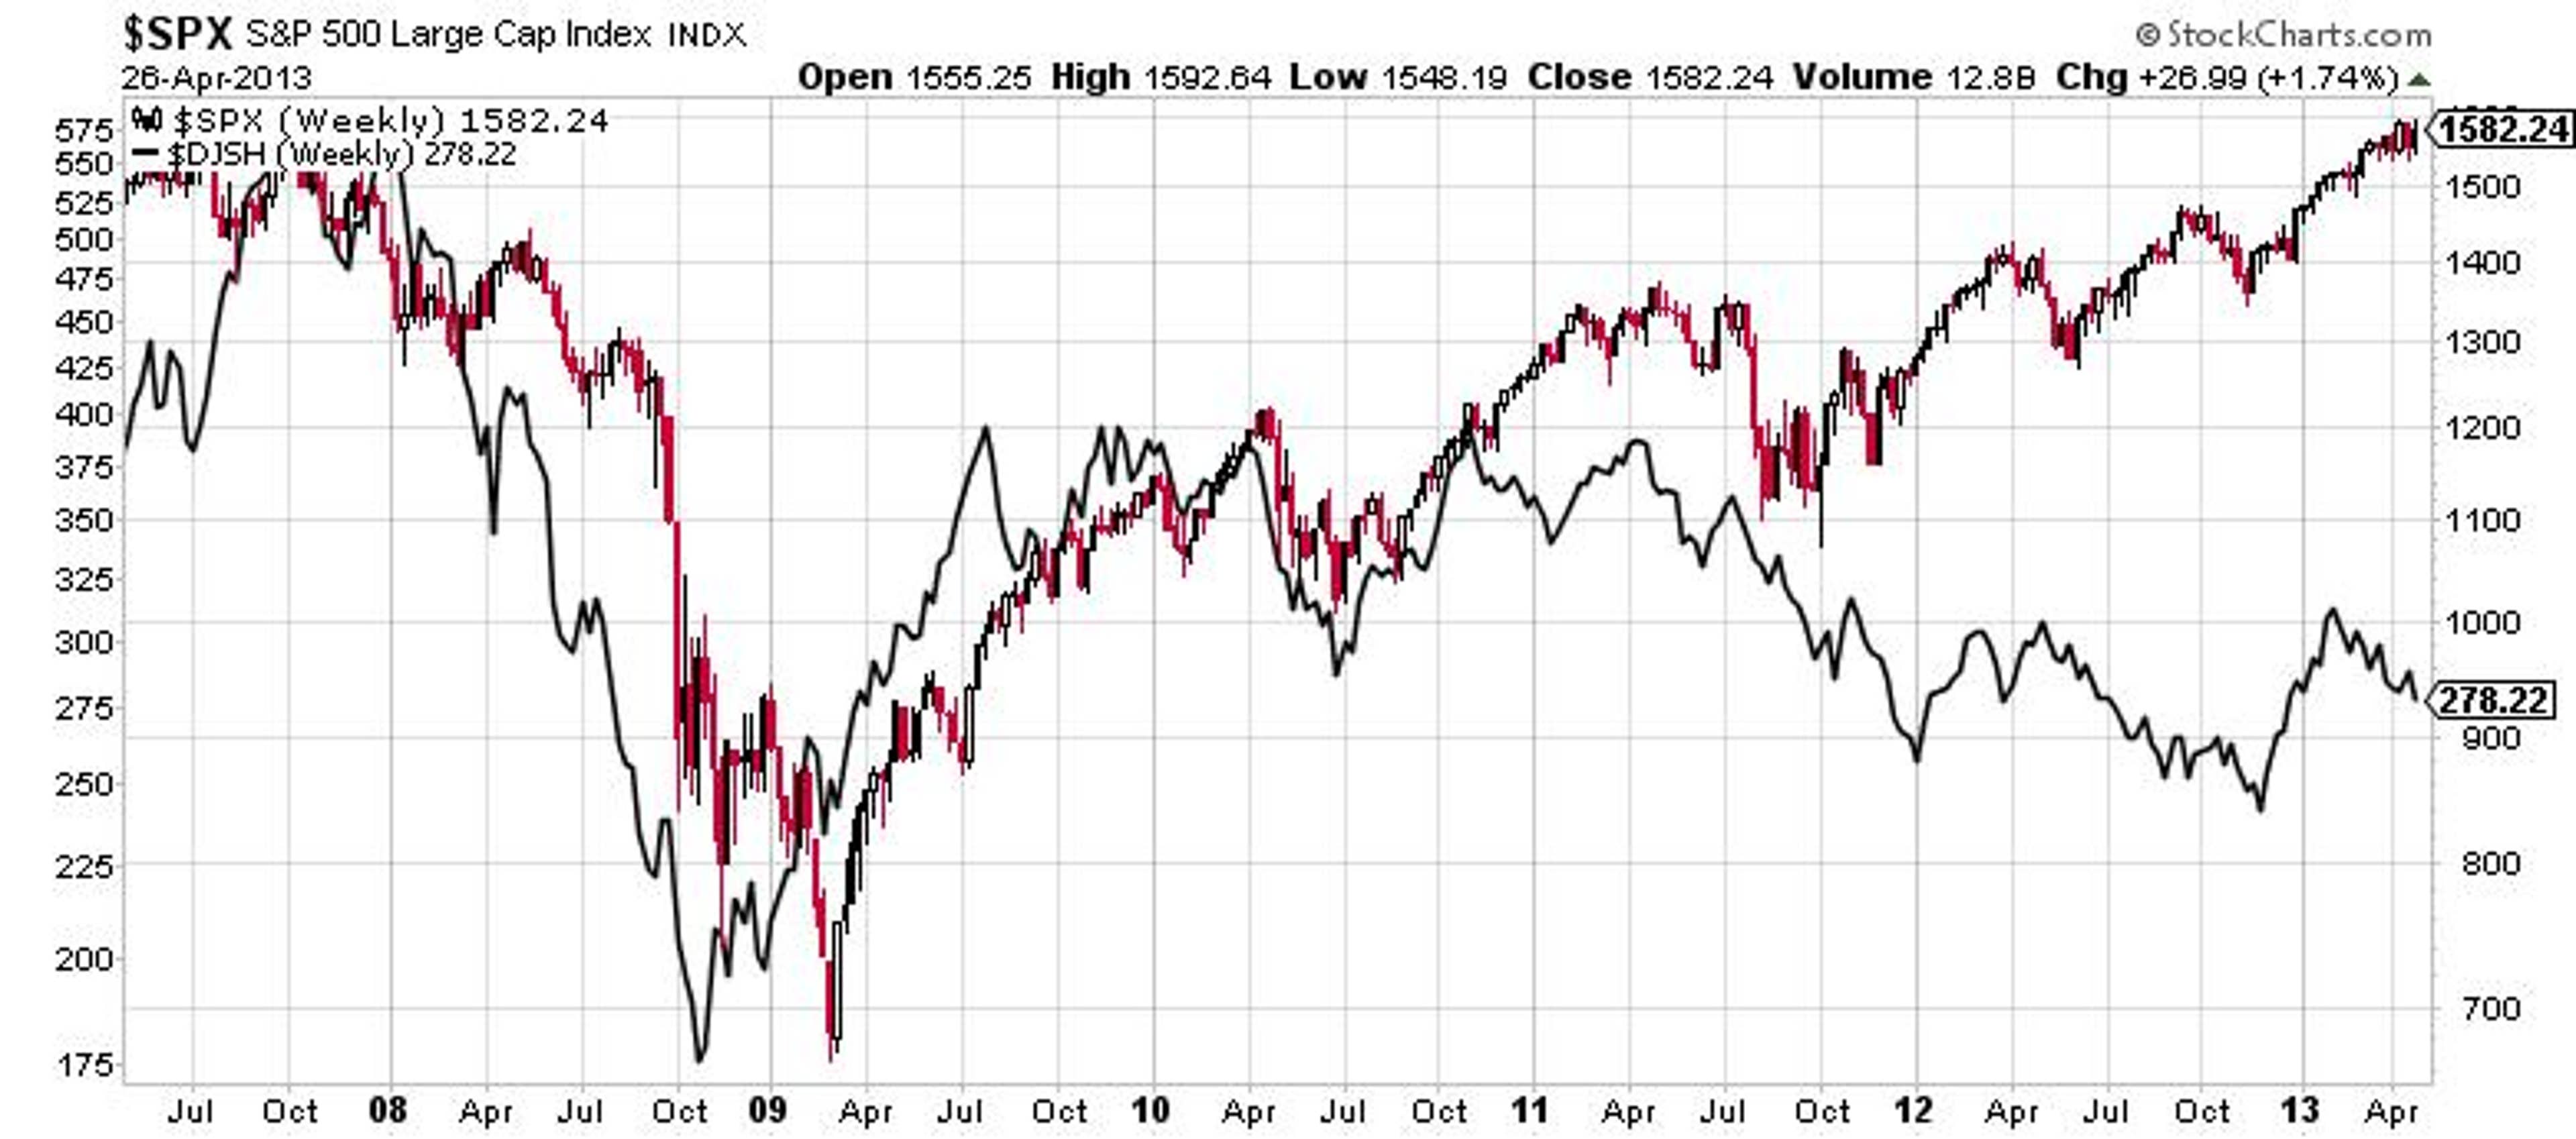
The Relative Strength Indicator – displayed at the top of the chart – measures technical strength or weakness. The last time that the S&P 500 hit today’s RSI levels, the financial crisis of 2008 crashed the market. Traders should tread very carefully in this market.
© 2024 Benzinga.com. Benzinga does not provide investment advice. All rights reserved.
Trade confidently with insights and alerts from analyst ratings, free reports and breaking news that affects the stocks you care about.

