


Does it sometimes feel impossible, to be one step ahead of the markets? Do you feel like the market actually knows where your stops are, as if it’s hunting yours and you keep getting stopped out, or stopped out more often than you like? Well, you may be partially right. The market exists to fill trades. There are ways though, techniques, some basic thinking knowledge actually, to keep you one step ahead of the markets. So instead of watching the market hunt down your stops, you can watch it hunt down your profit targets!
What is this basic thinking? It’s learning to think like most traders think, then figuring out how to profit from that. The first step is easy, because, well, like it or not, (and this is good), unless you are a successful professional floor trader, you are “most traders”. At least your natural instinct will be. This example is from a trade Darrell Martin did using the “natural instinct, most trader thinking” while taking a Crude Oil trade live, just after 10:00 AM on Friday July 18, on the Bull Bear Binary Hour radio show on TFNN.com.
First off, looking at the chart, you can see price action, expected volume and the expected move. These are the three pillars of information needed for profitable trading. It was a trade using Nadex binaries with an 11:00 AM expiration. The trade wasn’t meant to catch a major trend, just a quick scalp. What was needed was a contract that would make its move and be profitable by 11:00 AM. To make this kind of trade, a 5 minute chart was used to look for the CL trade, instead of diagnostic bars. Minute bars are great for quick scalping trades, whereas diagnostic bars are better used for finding trend trades.
To view image click HERE

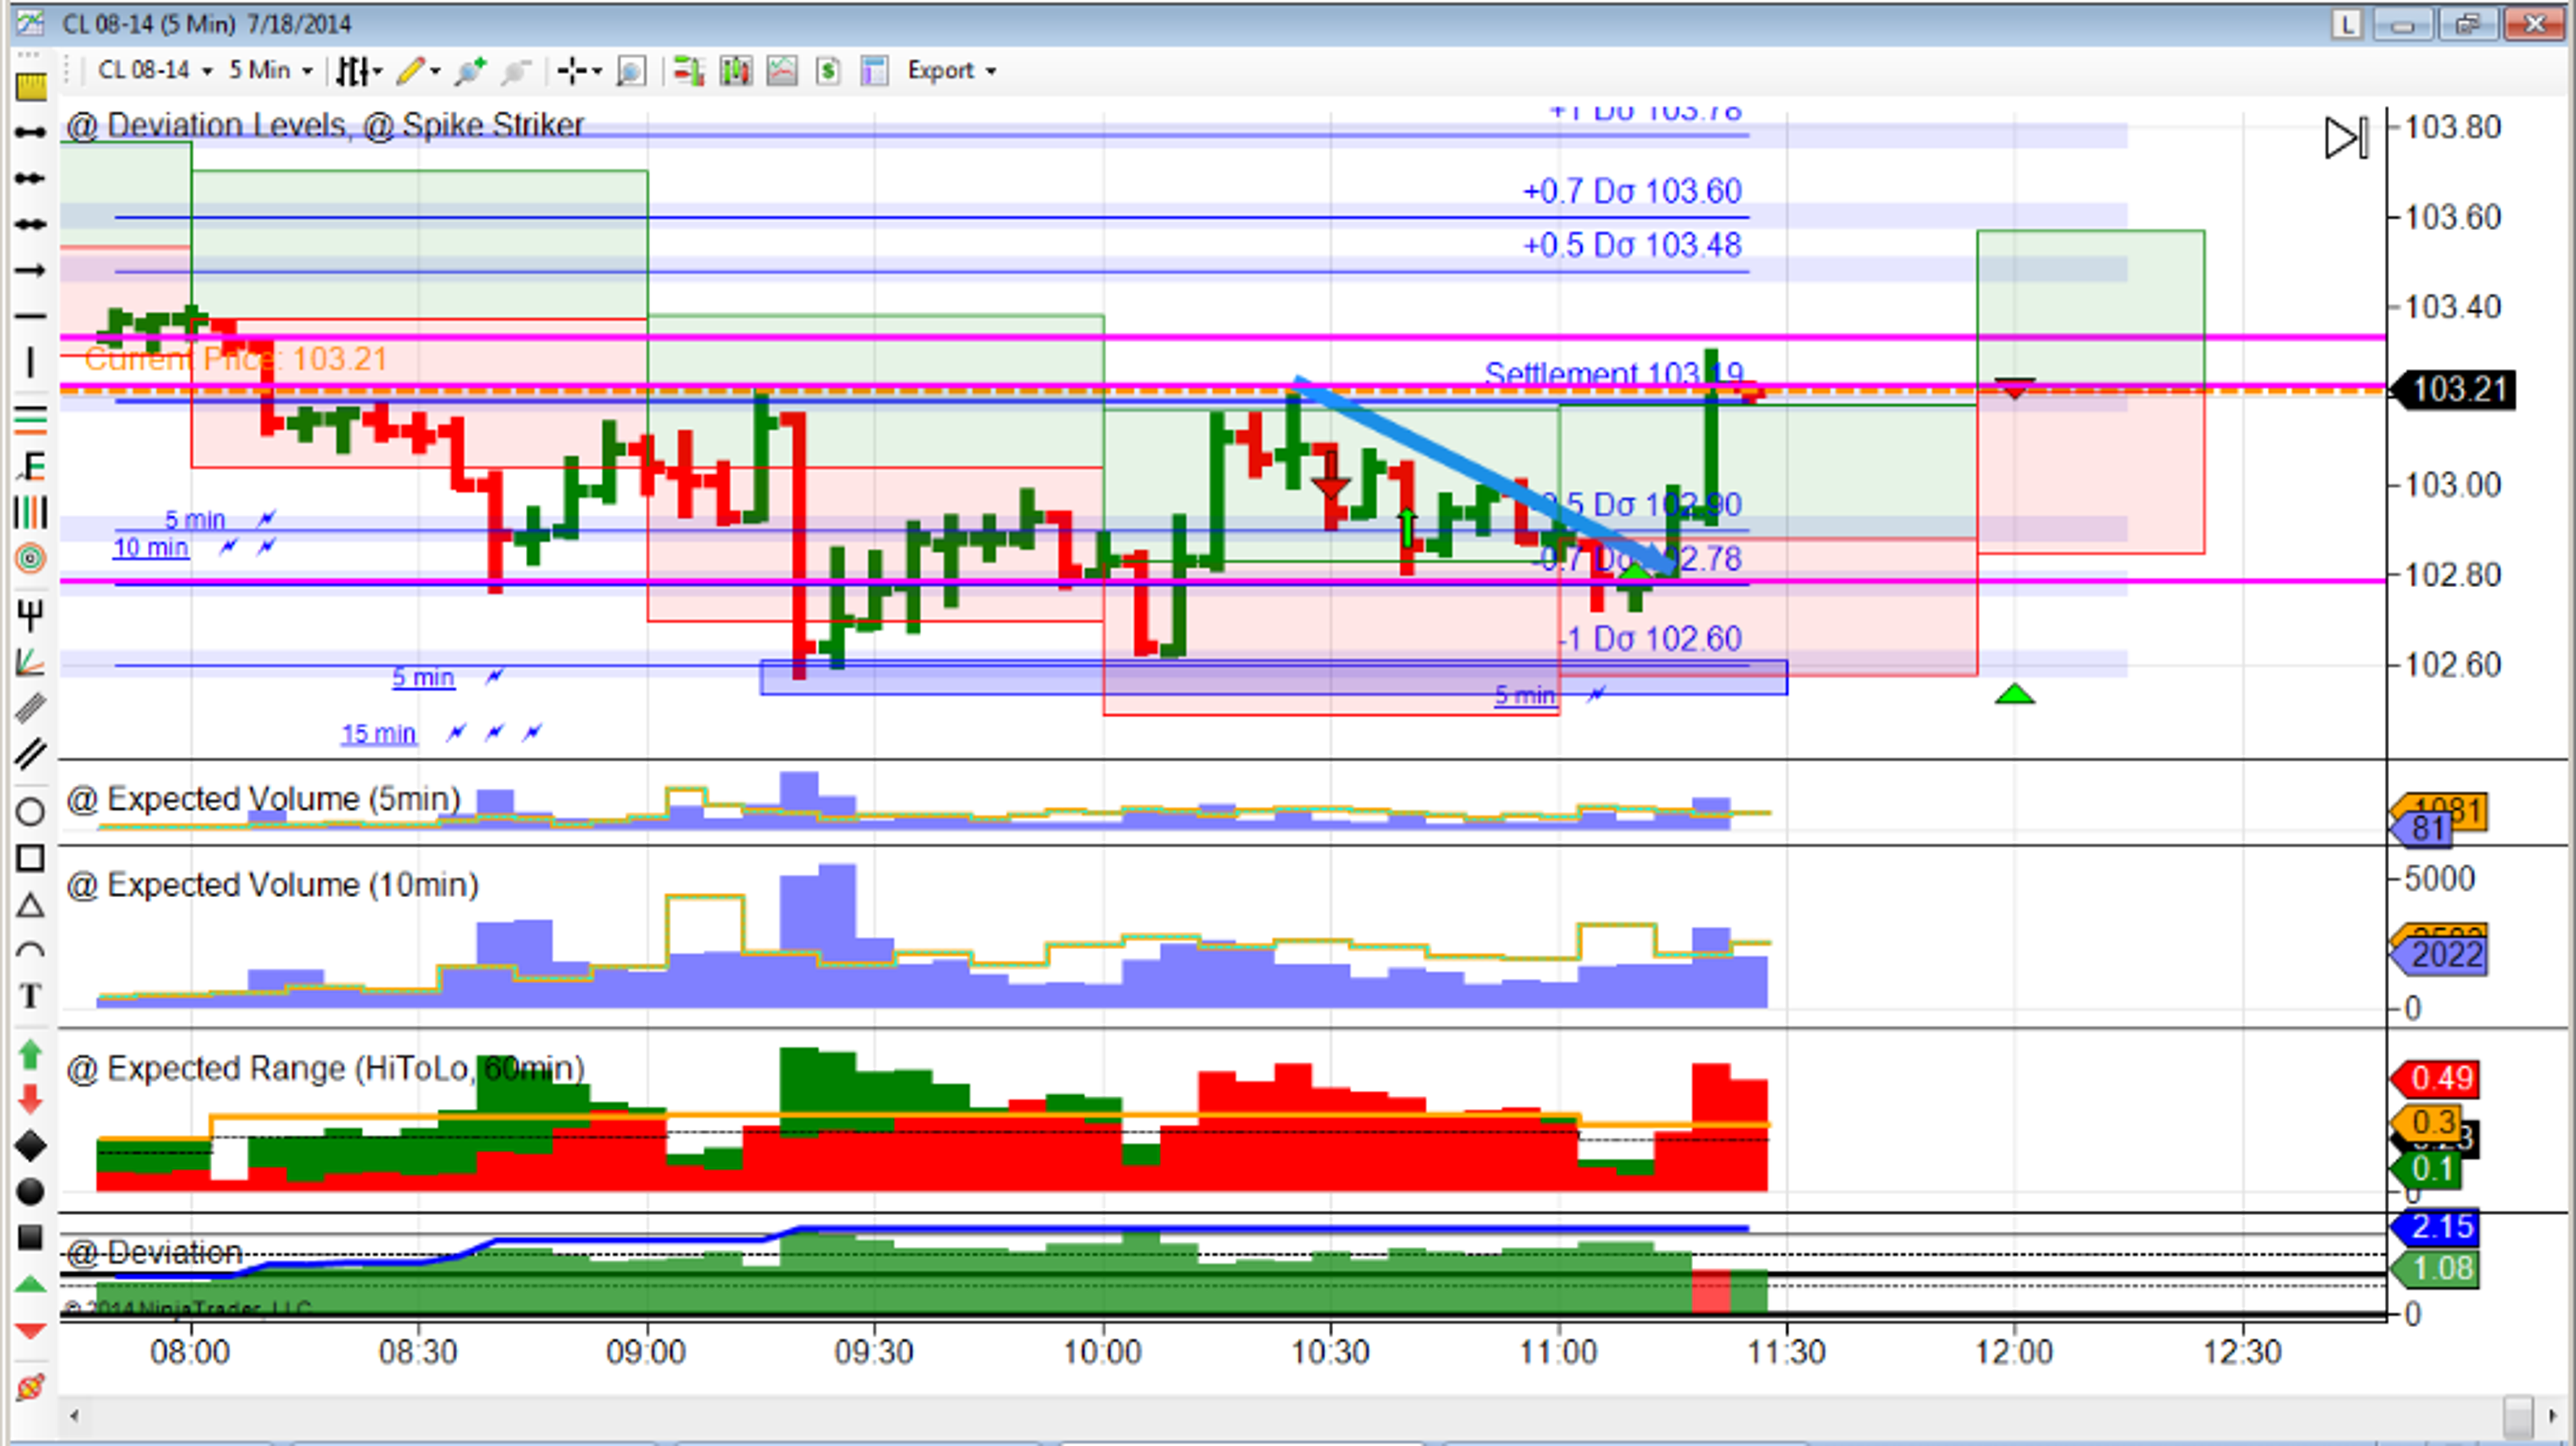
For a basic read of this chart, you can see after opening at 9:00 AM, price went up, hit settlement, came back down, then hit the -1 deviation line several times for two double bottoms, and made its way back up to settlement. A double bottom means that the price came down and hit the same price two times.
In the panel showing CL’s expected range, those bars hitting the yellow line showed CL had been making its expected move almost all morning.
Reading the violet purple volume bars in the other panels, you see those bars went up past their expected move yellow line.
You also can see that when price went down and hit the -1 deviation line at the first double bottom, volume greatly exceeded expectations, making 106.20 a magnet price. This meant that the 102.6 price level would now be like a magnet and attract the market to hit that level again. And it did, coming down for the second double bottom then going back up toward settlement.
At the settlement level again, three bars bounced off this level giving a strong indication the market would come down again. This was the time to look for the short binary.
There were a couple of choices and the one to choose was to sell the Out of the Money, (OTM) binary with a strike of 102.81 for $73. This binary was sold and the entry point was on the red bar down with the red arrow.
The Nadex binary being worth $100, less what it was sold for, $73, gives a total risk of $27. This is what is so great about OTM binaries. With low risk, setting a stop wasn’t necessary, that made for one less decision. Also, when the underlying market reached the strike of 102.81, the binary would be worth and priced around $50. At this point, you use your knowledge of how most traders trade. A take profit still needed to be set, and to do that, you needed to anticipate where you thought the market would go and how it would react.
Now, thinking like most traders, you ask, “If you were in a position in the opposite direction, where would you have gone long and gotten in the trade and where would you place your stop loss order?” That answer would tell you where all the buyers’ stop loss sell orders would be. Where their stops were waiting to be filled, was where you would want to target. Where those orders were, you could get out and take profit there.
The trader going long before, most likely would have entered just after the second green bar, (after 10:00 AM), broke the high of the previous green bar, which bounced off 102.6, the -1 deviation level. Where would their stops be placed if they were still in their trades, and hadn’t exited or been filled yet for profit? Their sell stops would be around the low, 102.82, of the second green bar up after 10:00 AM. They may have started with their stop below the first green bar, but would move it up as price moved up. Usually traders put stops one tick below the bar when long. Therefore, most traders who had gone long would have their stops at 102.81, which was right where the binary’s strike price was.
Knowing that, and knowing the price of the OTM binary would be around $50 right when the underlying reached the strike, the take profit was set to buy back at $57, giving it plenty of wiggle room. This provided the best opportunity to ensure exiting and taking profit. There was no need to worry about the market moving an extra tick for the price of the binary to actually hit $50, or even $53, and before the market had a chance to oscillate up, losing half the profit of the trade.
Let’s see what the market did and what happened to the trade. Again, the binary was sold where the red down arrow is. The market came down, bounced off of the -.5 deviation level, then came back down just far enough to 102.81 filling buyers’ sell back stop orders sitting there. The market would go there because the market is drawn to where the orders are; it exists to fill trades. That same thinking was applied to setting the take profit with the binaries and profit was taken at $57. Taking that trade, you can see several things in your favor: You knew where the deviation levels were, you knew the expected high to low range of the retracement, you knew 102.6 was definitely a magnet price and you had a good idea of where sell stop orders would be ready to fill your take profit buy order.
If you would like to learn more on how stay ahead of the markets, go to www.apexinvesting.com, a service provided by Darrell Martin. Apex Investing Institute Offers free education, and free access to the Nadex Binary and Spread Scanner Analyzers. In a supportive learning community of seasoned as well as up-and-coming traders, traders of all levels can learn how to trade Nadex binaries and spreads, as well as futures, forex, stock and options, and gain an edge for successful trading overall. Member traders are invited to trade in the rooms, take advantage of trade signal services, have key indicators and access the Apex Forum, which content is updated daily and includes over 7000 members.
© 2024 Benzinga.com. Benzinga does not provide investment advice. All rights reserved.
Trade confidently with insights and alerts from analyst ratings, free reports and breaking news that affects the stocks you care about.

