


(Wednesday market open) The new month looked a lot like the old one early Wednesday as an overnight rally in stock futures pulled back ahead of the open. Recent rallies, including one that faded yesterday, haven’t demonstrated staying power.
A Tesla TSLA investor meeting, manufacturing data from the United States and China and a host of earnings in the next two days all could help determine if stocks regain their footing.
As mentioned yesterday, keep a close eye on the U.S. dollar and Treasury yields. There’s mixed news early on, with yields slightly higher but the dollar easing a bit. U.S. manufacturing data due after the open (see more below) could influence yields and the dollar, with a solid reading perhaps lifting both and potentially pressuring stocks. Good news for the economy just means a Federal Reserve that has to be more aggressive hiking rates.
Just in
China reopening progress: It’s a big week for data from China, with the nation’s manufacturing PMI out late yesterday and composite and services PMI due Thursday. All could give clues into reopening progress. The manufacturing data exceeded expectations, rising to 52.6 from 50.1 the prior month and above the consensus estimate of 50.5, according to Trading Economics. It was the second-straight month of expansion in the manufacturing sector. The strong data, however, may actually be bad news for the rest of the world because it can work against what the Fed is trying to do.
Dollar Tree (DLTR) shares descended after the retailer beat earnings and revenue estimates but appeared to disappoint investors with its guidance.
It was a tough morning for retailers all around. Kohl’s KSS shares plunged 7% in premarket trading after the company missed analysts’ earnings expectations and provided disappointing guidance.
MBA weekly mortgage applications fell 5.7%, still soft but less dramatic than a nearly 14% drop the previous week.
Morning Rush
- The 10-year Treasury note yield (TNX) rose 2 basis points to 3.94%.
- The U.S. Dollar Index ($DXY) fell slightly to 104.16.
- The Cboe Volatility Index® (VIX) futures eased to 20.38.
- WTI Crude Oil (/CL) was steady near $76.50 per barrel.
February is finally over, and it saw almost every positive January trend reverse. Ominously, the TNX climbed about 40 basis points during the month and reversed all the downward progress it had made since November.
The last time the 10-year Treasury yield flirted with 4%, back in early November, the S&P 500® index (SPX) traded below 3,800, roughly 130 points under its current level. And that was when Wall Street hadn’t fully baked in the 3% to 5% drop in Q4 earnings many analysts now expect. March, therefore, appears to be living up to its reputation of coming in like a lion, at least for the stock market.
Eye on the Fed
Get ready for possible fireworks next Tuesday. That’s when Fed Chairman Jerome Powell is scheduled to deliver his semiannual testimony on policy to the Senate Banking Committee. When it comes to possible market-moving events, this is right up there with the March 10 Nonfarm Payrolls data.
A quick glance at the CME FedWatch Tool shows the probability of a 25-basis-point March rate hike at 73.8%, with chances for a 50-basis-point hike at 26.2%. That’s remained relatively stable this week.
Stocks in spotlight
TSLA holds its investor day today and it’s being broadcast online. It’s quite likely investors have questions TSLA management may not have complete answers to, such as how Q1 vehicle sales are measuring up after Q4 sales disappointed Wall Street. And there could be lingering questions about how CEO Elon Musk’s ownership of Twitter (TWTR) affects his focus on TSLA. While all those bows may not get neatly tied, Musk and other executives could conceivably touch on future expansion plans, energy storage progress, and the platform for TSLA’s cheaper robotaxi, according to Yahoo Finance. Based on a 5% rally Monday and premarket strength, investors appear ready to hear good things from the electric vehicle maker.
Shopping carts: After all the talk about earnings season winding down, Thursday’s calendar might seem surprising. We’ll wake up to reports from Kroger (KR), Macy’s (M), and Best Buy (BBY), and after the closing bell comes Costco (COST).
It’s important not to group all retailers together, and tomorrow’s earnings calendar is a good example of why. It’s hard to think of four more different companies than KR, M, COST, and BBY, all serving different groups of customers with products all over the map. Comparing grocery sales at COST and KR, clothing sales at M, and computer sales at BBY isn’t an apples-to-apples type of analysis, so be careful to check each company’s individual fundamentals and outlooks.
Individually, COST had a rough outing last earnings season. Shares fell after the company missed earnings and revenue expectations. At the time, executives said there was pressure on big-ticket and discretionary purchases, so we’ll see if that changed this time around. In January, COST reported a 6.9% rise in monthly sales from a year earlier. KR had a strong quarter the last time it reported, with rising grocery prices pushing up revenue and leading to a higher forecast from the grocery company.
What to watch
February’s Institute for Supply Management (ISM) Manufacturing data is due right after the open and probably the most meaningful report we’ll see this week. Though the headline number is important, keep in mind that the report’s New Orders data can give investors a better sense of how manufacturers see the near future. In January, that data was very weak at 42.5. If February’s reading also comes in low, it could provide fuel to the Fed’s argument that goods demand continues to sink even as services demand remains bountiful. Prices paid, which rose sharply to 44.5 in January, bears watching.
As of late Tuesday, Briefing.com reported analysts’ estimates for headline PMI Manufacturing at 47.8%, up from 47.4% in January. Still, a below 50 report implies contraction.
Market minutes
Here’s how the major indexes performed Tuesday:
- The Dow Jones Industrial Average® ($DJI) fell 232 points, or 0.71%, to 32,656.
- The Nasdaq Composite® ($COMP) fell 0.1% to 11,455.
- The Russell 2000®(RUT) rose 0.04% to 1,896.
- The SPX dropped 12 points, or 0.3%, to 3,970.
Just looking at the $DJI would give you a skewed view of yesterday’s market performance. A bad day for a handful of the 30 stocks in that index led to headlines about a “200-point loss,” but losses in the more wide-ranging SPX and $COMP were far lighter, and the RUT actually rose a little.
- Health care stocks took down the $DJI Tuesday, highlighted by sharp losses in shares of Merck (MRK), Amgen (AMGN), Johnson & Johnson (JNJ), and UnitedHealth Group (UNH). Health care is one of the worst-performing sectors year to date. A recent report in Financial Times noted that U.S. health care companies are saddled with debt, making it more challenging to pay for labor as interest rates rise. One-fifth of U.S. distressed bonds were issued by health care companies, leading to warnings from ratings companies, the paper reported.
- Still, health care didn’t take home the prize for worst-performing sector Tuesday. That trophy belonged to utilities, which continue to be pressured in part by rising interest rates. As rates rise and yields go up on bonds, utilities can become a bit less attractive to investors seeking yield. At such times, they can often get better yields in fixed income rather than in sectors like utilities, health care, or energy. It may be no coincidence then that those sectors are the three poorest performers of 2023 so far.
- Speaking of yields, the Treasury market didn’t climb or fall dramatically Tuesday, and the 2-year Treasury yield actually fell late in the day. The U.S. dollar index stayed under 105. That said, the dollar and yields remain near recent three-month highs and didn’t provide much in the way of support for stocks either. The two best-performing sectors were rate-sensitive info tech and consumer discretionary, which would potentially lose ground if yields and the dollar resume their respective rallies.
- February is over and few investors are likely to miss it. The $DJI fell 4.2% during the month, and the SPX and $COMP fell 2.6% and 1.1%, respectively.
Talking technicals: A game of ping-pong is going on in the benchmark SPX, which is bobbing back and forth between its 200-day and 50-day moving averages (see chart below). On Monday, the SPX managed to close above the 50-day moving average (MA) near 3,979. When buying dried up Tuesday, the SPX sank below the 50-day MA, though not far enough to challenge the 200-day MA near 3,940. That’s just under last week’s low and could represent technical support on any further move down.
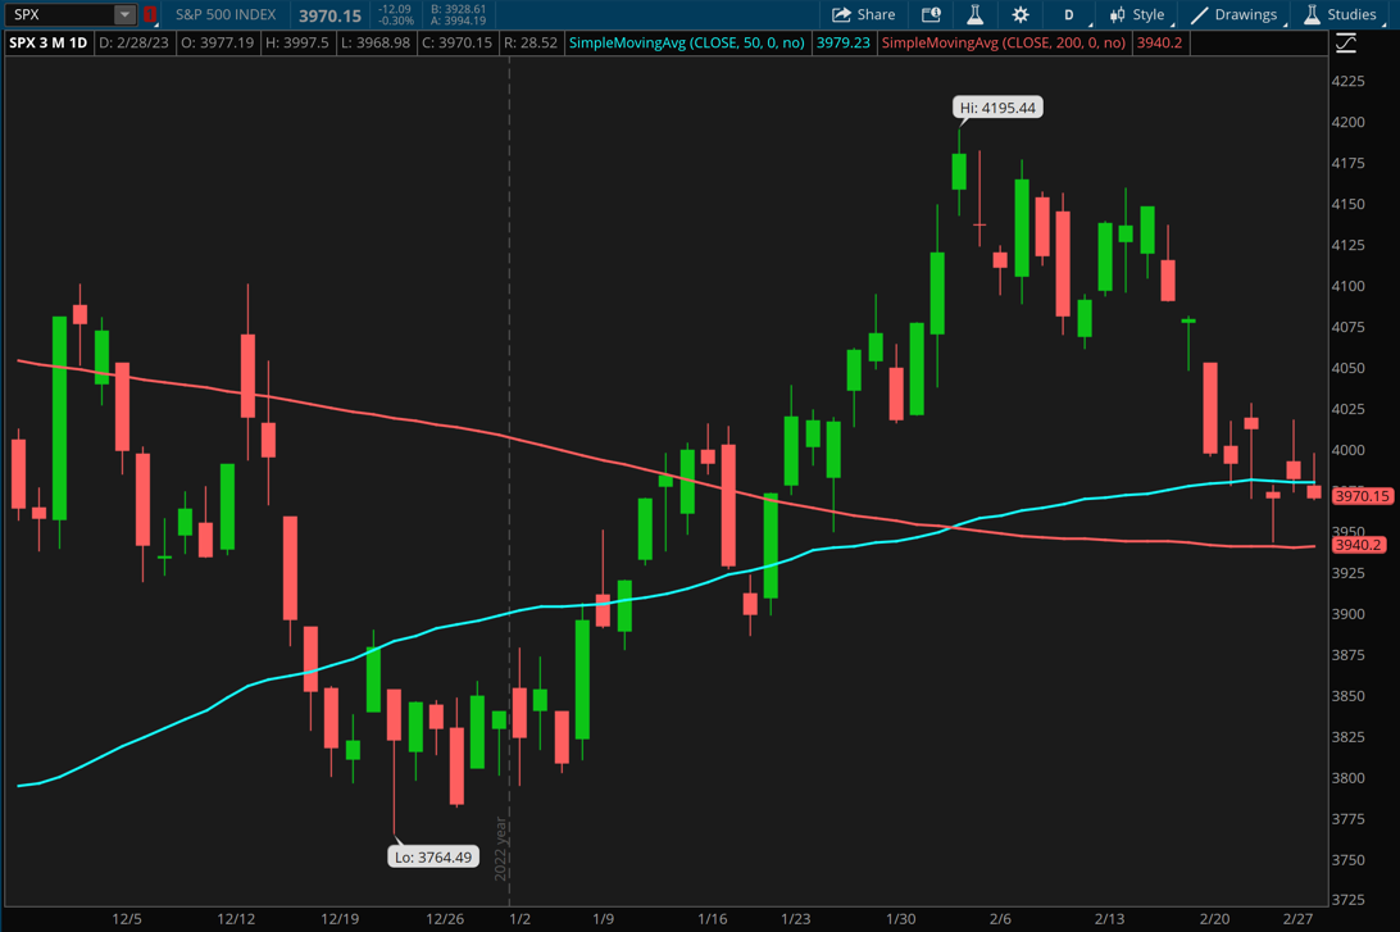
CHART OF THE DAY: PING-PONG. That space between the 200-day MA (red line) and the 50-day MA (blue line) for the S&P 500 index (SPX—candlesticks) may represent a narrow trading range for the index in coming days. A serious drop below or push above either moving average could help set near-term direction. Judging from recent action, there’s not much appetite for a major move back to levels seen in early February. Data source: S&P Dow Jones Indices. Chart source: The thinkorswim® platform. For illustrative purposes only. Past performance does not guarantee future results.
Thinking cap
Ideas to mull as you trade or invest
Rising sun: You read about the Fed everywhere, but the Bank of Japan (BoJ) often flies under the radar. Investors should pay more attention to the BoJ because policy changes there can have the potential for major impacts on global financial flows and markets. For instance, since October of last year, BoJ policy has helped offset the impact of the Fed’s quantitative tightening (QT) on global financial conditions, keeping them from tightening and coinciding with the rally in stocks and bonds, according to Charles Schwab Chief Global Strategist Jeffrey Kleintop. With Kazuo Ueda taking over as the BoJ’s central bank governor in April, might a policy shift spark an unraveling of this borrowing and a repatriation of capital back to Japan that could prompt turmoil across global markets in the coming months? Check Kleintop’s analysis.
Terrible 2s: On Monday, the 2-year Treasury note yield reached a new 15-year high above 4.85%, well above last autumn’s apex. The 2-year yield is likely to remain more sensitive to Fed actions and perhaps more volatile than the TNX in coming weeks. This could potentially drive choppy, volatile trading in the stock market, especially as we get closer to Fed Chairman Jerome Powell’s scheduled testimony to Congress March 7. How closely does the 2-year yield correlate with actual Fed rates? The 2-year rose above 6% back in the 1999 – 2000 period at the height of the info tech rally. At that time, the Fed funds rate was on its way to a May 2000 peak of 6.5%. At this point, few if any analysts expect the Fed to go that high, but then again, no one a year ago would’ve expected us to be on the verge of 5% by this point.
Is bad news still good? If so, yesterday’s Conference Board Consumer Confidence and housing data should’ve given the stock market a nice boost. The S&P CoreLogic Case-Shiller Home Price Index rose just 4.6% in December, down from 6.8% the prior month. And February Consumer Confidence of 102.9 was well shy of analysts’ consensus. These data might have some wondering if the Fed risks tightening things too much. The Consumer Confidence report, for instance, showed consumers pulling back on spending amid high prices and rates and planning fewer purchases of homes, autos, and major appliances. They’re also cutting back on vacation plans. Reading these takeaways in the context of Target (TGT) reporting falling margins in addition to a weak outlook similar to other big-box stores, it helps clarify how rising prices and tighter conditions are hurting not just consumers but also retailers.
Calendar
March 2: Preliminary Q4 Productivity and expected earnings from Anheuser-Busch (BUD), Broadcom (AVGO), Best Buy (BBY), Kroger (KR), and Macy’s (M)
March 3: February ISM Non-Manufacturing Index
March 6: January Factory Orders
March 7: January Wholesale Inventories and expected earnings from Dick’s Sporting Goods (DKS)
March 8: January JOLTS Job Openings, ADP Employment, Fed Beige Book, and expected earnings from Campbell Soup (CPB)
TD Ameritrade® commentary for educational purposes only. Member SIPC.
Image sourced from Shutterstock
This post contains sponsored advertising content. This content is for informational purposes only and not intended to be investing advice.
© 2024 Benzinga.com. Benzinga does not provide investment advice. All rights reserved.
Trade confidently with insights and alerts from analyst ratings, free reports and breaking news that affects the stocks you care about.

