


(Thursday Market Open) After yesterday’s huge rally, data early today provided fresh positive confirmation that inflation is becoming less of a problem and focus is shifting to what kind of economy we’ll face in 2023. Right now, the market seems happy with how things are going, and hopes are rising that the Federal Reserve will ease off the gas pedal as we round this final turn.
Yesterday was all about waiting for Federal Reserve Chairman Jerome Powell’s speech. Today could be all about waiting for tomorrow’s Nonfarm Payrolls data, which we’ll see before the open Friday. Analysts anticipate November jobs growth of around 200,000, down from October’s 261,000 but still historically strong (see more below). Trading could be uneventful ahead of the data.
In general, the market would likely view a job number that exceeds expectations as more reason for the Fed to be hawkish, a likely negative for stocks. However, if numbers come in well below consensus on jobs growth, that could spur serious concerns about the economic trajectory.
The best-case scenario, if you’re a bull, is probably a small miss in headline jobs, accompanied by wage growth in line with consensus or slightly below.
Morning Rush
- The 10-year Treasury yield (TNX) fell one basis point to 3.59, the first time under 3.6% in nearly two months.
- The U.S. Dollar Index ($DXY) was at 105.4, just above its 200-day moving average (MA) of 105.3. It hasn’t been under its 200-day MA since mid-2021.
- Cboe Volatility Index® (VIX) futures fell to 20.6.
- WTI Crude (/CL) were at $81.47 per barrel.
Powell’s speech yesterday helped send yields, the dollar, and volatility lower while putting a charge into Wall Street. The S&P 500 index® (SPX) enjoyed its best day since November 10, when it rallied 5% following milder-than-expected October Consumer Price Index (CPI) data. More on the speech below, but first let’s see what the morning papers say.
Just In
In this big data rush before the open, perhaps tops on the list is October Personal Consumption Expenditures (PCE) prices, the Fed’s favored inflation index. Headline PCE inflation rose 0.3%, below the 0.4% Wall Street consensus and the same as in September. Core PCE rose just 0.2%, in line with consensus and down from September’s 0.5%. PCE numbers provided more confirmation that inflation appears to be moderating, and stock index futures jumped on news.
Continued jobless claims offered more evidence. Popping over 1.6 million for first time since early in the year, the report showed even more signs that the job market may also be moderating. Weekly claims of 225,000, however, were below the consensus for nearly 240,000.
In other news:
- Dollar General (DG) shares got crushed ahead of the opening bell after reporting earnings per share (EPS) that came in below Wall Street’s expectations. However DG met consensus on revenues and reaffirmed fiscal 2023 guidance. However, in this time of low earnings expectations, companies that miss are getting punished.
- Things were brighter down the aisle at Kroger (KR) this morning as it beat EPS forecasts and posted revenues in line with Wall Street’s thinking. KR also raised fiscal 2023 guidance and shares rose nearly 3% in premarket trading. This came after a strong grocery quarter for Walmart (WMT) and may be another sign that Americans have prioritized grocery spending in inflationary times while pulling back on discretionary items.
- Before KR and DG this morning, a bunch of major companies reported last night after the close, and most of the tidings looked positive. That included earnings-per-share (EPS) beats from Costco (COST), Salesforce (CRM), and Synopsys (SNPS), though CRM slightly disappointed by offering Q4 revenue guidance that was below Wall Street’s consensus view. CRM shares got slammed in overnight trading.
Continuing our look back at yesterday, Powell certainly had some encouraging words, including that the time to start moderating rate hikes might be as early as the next Federal Open Market Committee (FOMC) meeting December 13-14, and that the central bank doesn’t want to overtighten. Investors might also take note of what Powell said about the Fed’s options, such as raising rates more slowly or holding on “longer,” which would mean keeping rates at high levels over a more extended period.
The Fed has made the mistake before of lowering rates too soon during an inflationary period and most certainly wants to get things right this time. Whether the economy can make a soft landing where unemployment stays low even as inflation comes down is the question. The Fed is in position to do that, Powell said, but investors should note it’s a tricky business and historically, not every Fed Chairman sticks the landing. In fact, the economy may already be experiencing a “rolling” recession, as you’ll see below.
Data Dive, Part Two
By now you’ve seen yesterday’s data, but just a quick go-over and some thoughts.
- November’s Chicago PMI report was a big disappointment, coming in at 37.2. The consensus headline estimate was 47.5, and October’s figure was 45.2. The November headline was the worst since the depths of the pandemic, and it could be a flashing light signaling a possible recession. One month, of course, isn’t a trend. But if December’s figure also comes in below 40, that would be a very bearish sign for the economy. The November ISM Manufacturing Index is due soon after the opening bell, and that data now becomes more important to see if it also reflects weakness. Consensus for ISM is 49.8%, Briefing.com said. That’s down from 50.2% in October. Anything below 50 indicates contraction.
- The Job Openings and Labor Turnover Survey, better known as the JOLTS survey, saw a slight dip to 10.3 million, down from 10.7 million previously. Remember, this report was often at around 7 million in pre-pandemic times, so it remains well above normal levels. With openings elevated, they’re a clear barrier to any ease in wage pressure. And wage pressure often means more inflation.
Fed Spin: If you’re Powell or another FOMC member, your head might’ve been spinning as all the data poured in yesterday morning. The trends were somewhat hard to glean.
For instance, what are investors (and the Fed) to make of Q3 Gross Domestic Product (GDP) climbing to 2.9% in the government’s second estimate (from 2.6% in its first reading), even as pending home sales slid 4.7% month over month in October? Or what about ADP jobs growth slowing to 127,000 in November from 239,000 in October even as JOLTS remained historically high above 10 million?
Reviewing the Market Minutes
When a market that’s been so soft for so long has a day like Wednesday, one question to ask is how broad was the rally? Meaning did stocks across various sectors do well, or did a few mega-caps have an outsized impact on index performance? Wednesday’s rally looked robust, embracing every sector.
Gains ranged from 0.6% for energy to 5% for info tech, and advancers led decliners by a 6-1 margin on the New York Stock Exchange (NYSE). Volume far eclipsed average daily levels, another typical sign of health in a rally. In all, November turned into a solid month highlighted by a 5% gain for the SPX.
Here’s how the major indexes performed Wednesday:
- The Dow Jones Industrial Average® ($DJI) climbed 737 points, or 2.18%, to 34,589. It rose nearly 6% in November. It’s now up slightly over the last year, though still down 6% from January’s all-time high of nearly 37,000.
- The Nasdaq Composite® ($COMP) gained 4.41% to 11,468. It rose about 4% in November.
- The Russell 2000® (RUT) rose 2.72% to 1,868. It rose just 2% in November, trailing other major indexes.
- The SPX added 3.09%, or 122 points, to close at a nearly three-month high of 4,080
The SPX’s close above its 200-day moving average (MA) of 4,050 marked the first time since late April that it managed that feat. Investors generally put too much importance on MAs, but psychologically, it’s an interesting accomplishment. The SPX remains in a technical downtrend, however.
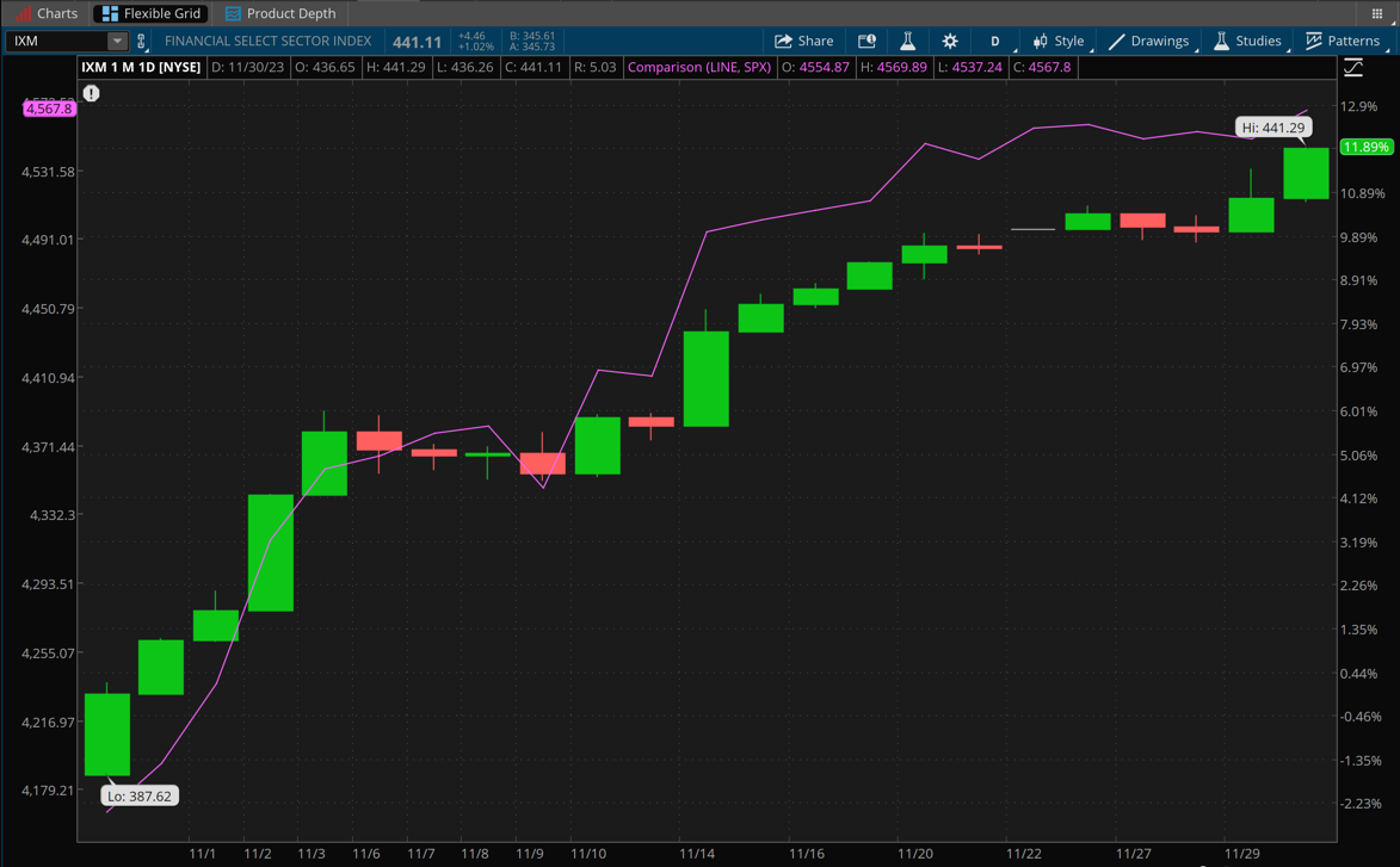
CHART OF THE DAY: BETWEEN THE LINES. The SPX (candlesticks) spent most of November in a narrow range between its 100-day MA (blue line) and its 200-day MA (red line). Both could form areas of psychological support and resistance, though the SPX pierced the 200-day in its rally Wednesday. The recent tight trading range isn’t really characteristic of 2022, which saw far more volatility right through October. Can the tight range last, and if not, what’s the next step—up or down? Wednesday may not be the final word. Data source: S&P Dow Jones Indices. Chart source: The thinkorswim® platform. For illustrative purposes only. Past performance does not guarantee future results.
Three Things to Watch
Payrolls Preview: It feels like this entire week has built up to Friday morning at 8:30 ET when investors get a look at the November Nonfarm Payrolls Report. Again, Wall Street consensus is at jobs growth of around 200,000, according to Briefing.com. The headline number could spark dramatic futures market action right after it posts, but don’t forget to dig deeper and check key figures like hourly earnings and labor force participation. Hourly wages rose 0.4% monthly and 4.7% year over year in October. Labor force participation edged down to 62.2% from 62.3%. Higher participation would be considered bullish because more workers competing for fewer jobs tend to stabilize inflationary wage levels.
Rolling Recession? Despite the Wall Street rally yesterday, it’s probably too early to get excited about the economy. In fact, the United States might already be experiencing what Charles Schwab’s Chief Investment Strategist Liz Ann Sonders called a “rolling recession” that could hurt corporate earnings and put pressure on stocks.
“We’re already in a version of recession. We’ve been talking about it in the context of a rolling recession. There are pockets of the economy that are undoubtedly in recession territory,” Sonders said on CNBC Wednesday, citing weakness in the housing industry, weak CEO and consumer confidence, and high inflation. A “rolling” recession means various sectors experience weakness at various times. This potentially means weakness would be isolated by sector rather than throughout the market.
Talking Technicals: Are you watching your Fibonaccis? So-called Fibonacci numbers, a favorite among many technical traders, apply numeric sequences and ratios to help ascertain price targets and offer a sense of whether a market move has run its course. Fibonacci retracements can help pinpoint how far a stock might fall before resuming its prior trend. Although there are some variations, three widely used levels are 38.2%, 50%, and 61.8%. Often, one of these retracements from a recent peak can act as a support level during a short-term decline. Buying interest then emerges, and the market bounces back. No guarantees, of course.
If the SPX drops below current support near the 100-day moving average of 3,919, some technicians believe the next point of support could be the 38.2% Fibonacci retracement of 3,819. How is this calculated? The SPX climbed 2,627 points from its March 2020 low to its January 2022 high, and 3,819 would mark a 38.2% retracement from the peak of that rally.
Notable Calendar Items
Dec. 2: November Nonfarm Payrolls and expected earnings from Cracker Barrel (CBRL)
Dec. 5: November ISM Non-Manufacturing Index and October Factory Orders
Dec. 6: October Trade Balance and expected earnings from AutoZone (AZO) and Casey’s General Stores (CASY)
Dec. 7: October Consumer Credit and expected earnings from Campbell Soup (CPB)
Dec. 8: Expected earnings from Broadcom (AVGO) and Costco (COST)
Dec. 9: November Producer Price Index (PPI) and Preliminary December University of Michigan Consumer Sentiment Index
Dec. 12: November Treasury budget
TD Ameritrade® commentary for educational purposes only. Member SIPC.
Image sourced from Shutterstock
This post contains sponsored advertising content. This content is for informational purposes only and not intended to be investing advice.
© 2024 Benzinga.com. Benzinga does not provide investment advice. All rights reserved.
Trade confidently with insights and alerts from analyst ratings, free reports and breaking news that affects the stocks you care about.

