


Wednesday, the Federal Open Market Committee elects to raise the Prime Rate 1/4 point, as expected, and hints at the possibility of doing so again each scheduled meeting this year.
After this FOMC Announcement, the S&P500 initially slumps; but, then bounces back well into the market close, as Fed Chairman Powell emphasizes relative income and consumer strength in the economy.
The Congressional cycle, Annual cycle, Quarterly cycle, Bi-Monthly cycle, and Monthly cycle technical slope momentum price trajectories, in the S&P500, come into key alignments and synchronizations.
Traders ask if it is truly time to buy into the US Large Cap Equities Composite Index again, or if "further Fed hike headwinds" are still too strong.


Wednesday's S&P500 Large Cap Equities Composite Index market price reaction to the FOMC prime rate announcement actually presented little new.
As expected, the market initially slumped, as investors processed the announcement as relatively hawkish. Accompanied by indications Wednesday's hike would likely be the first of many this year (in fact, potentially the first in a continuous string of hikes through the course of the year at each scheduled meeting), the market erased all of its 'well over 400 points of gains' added since the day before, and headed into negative territory. And did all this within the 35 minutes following the Fed's interest rate hike announcement Wednesday at 2PM ET USA.
However, as Fed Chairman Powell proceeded to speak, and began to highlight his view of the relative health of the US economy, especially in the light of Covid, domestic inflation, and European war, the US equites market rebounded, and rebounded significantly, running to ever higher intraday highs. It may be interesting to note this later positive 'turn around' market price action was broad, and also occurred on the heals of a significant Chinese 'market bounce' overseas that had occurred the night before.
Some traders are now asking, "Can this significant post-Fed announcement, and positively interpreted Chairman Powell narrative, and following positive market price action, mean we have seen our 'quarterly bottom, and is it time to buy again?" After Wednesday's market close, many a hopeful financial wonk can also be heard 'media chattering' that they are beginning to think so, although perhaps still remaining a bit trepid.
Cautiously, I, an associate of PROTECTVEST, would like to review some key charts of the S&P500 SPY ETF before I actually become too inclined to lift my own full hedge price insurance application I admonished for 'SPY ETF holdings' back in mid-December of 2021, and then also strongly reiterated once again the first week of January 2022.
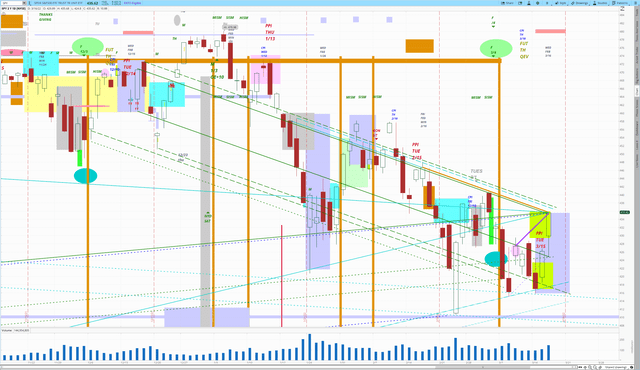
Looking at the chart below, and some overlay I have provided, you can find some very interesting and revealing, features on the SPY, regarding price cyclicality, price momentum, and price trajectory, and their possible implications forward, especially if you are prone to maintain a criterion of continuance within your forward forecast projection framing.
S&P500 SPY ETF - INSIDE THE QUARTERLY CYCLE - DAILY CANDLES PERSPECTIVE
XEV-SRP -TPP: WHERE X EQUALS TIME CYCLE LENGTH
1. QUARTERLY - SOLID GREEN
2. BI-MONTHLY - SOLID AQUABLUE
3. MONTHLY - SOLID GOLD
4. WEEKLY - SOLID PURPLE
AND SRP EQUALS STARTING/REFERENCE/POINT AND TPP EQUALS TIME/AND/PRICE/POINT CANDLEPOINT DESIGNATION: REGULAR MARKET HOURS, DAILY CANDLE HIGH

MDPP PRECISION PIVOTS GLOBAL FINANCIAL MARKETS LABORATORY
(WEDNESDAY 3/16/22 7:00PM ET USA UPDATES: GET READY FOR MARCH MONTHLY OPTIONS EXPIRATIONS THIS WWEK!
KEY ACTIVE QUARTERLY TIME CYCLE PIVOT POINT PRICE PROJECTION INDICATORS UPDATE - DAILY CANDLES PERSPECTIVE UPDATE - GREEN - WITH QUARTERLY EBP (ECHOBACKPERIOD) AND ITS FORWARD TIME CYCLE SLOPE MOMENTUM TRAJECTORY ALSO HIGHLIGHTED AND ILLUSTRATED - ALONG WITH FORWARD CYCLICAL PIVOT POINT IMPLICATIONS WITHIN A CRITERION OF CYCLICAL SLOPE MOMENTUM CONTINUANCE
What we is the quarterly time cycle echovector, the bi-montly time cycle echovector, and the monthly time cycle echovector are each in alignment going into Wednesday's FOMC announcement day close. And that in each case the two days following each of the Wednesday EchoBackDays (one, two and 3 months earlier) provided market downpressure into options expiration.
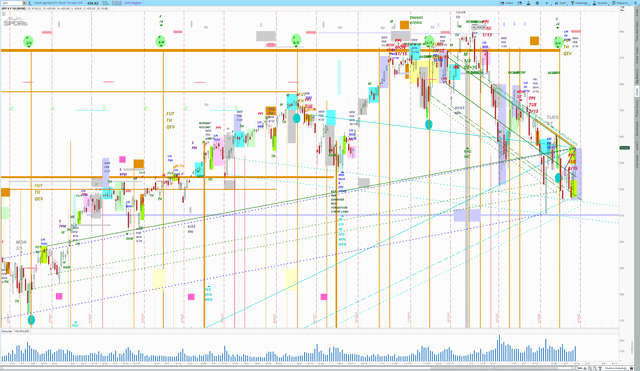
Further zooming out the provided market intelligence illustrated "Today's Tomorrow Traders Edge" framechart grid, from the prior quarterly zoom, to also include a full year's perspective, we see this downpressure also occurred 2 quarters ago, three quarters ago, and a year ago... from each of those cyclical echobackweek Wednesdays, right on into the following options expiration Fridays.

MDPP PRECISION PIVOTS GLOBAL FINANCIAL MARKETS LABORATORY
This is powerful (albeit not necessarily conclusive) forecast projection bias and implication, within the criterion of continuance, regarding momentum and cyclical history price action, especially for shorter term traders in derivatives and esoterics.
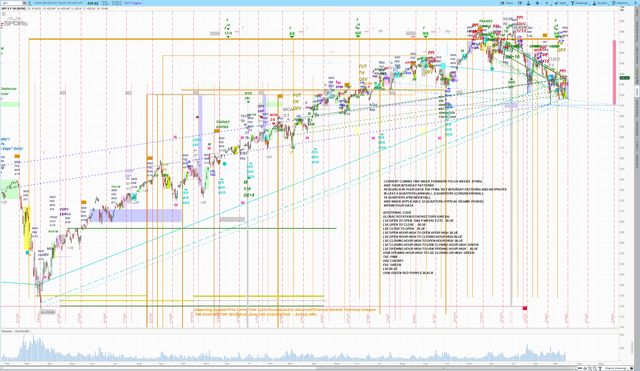
Interestingly, and in a side note, if we zoom out yet further, to include the 2-year Congressional cycle, we once again find interesting cyclical support in the week following each of these key monthly option expirations (MJSD - March, June, September, December), and their 'prior weeks' Wednesdays.
MDPP PRECISION PIVOTS GLOBAL FINANCIAL MARKETS LABORATORY
For these reasons, I am inclined to be very observant of market price dynamics this week and into next, as I consider SPY ETF hedge insurance applications and techniques. In that regard, I am incline to again consider utilizing and placing "dynamic, active, and adjustable straddling positions in order to lock in gains and to better manage exposure to general market price level changes in either direction. Setting advanced management straddles at key coordinate forecast levels is a very effective and opportune approach, and an advanced position management and trading strategy. Using this approach at this time could prove very valuable in effectively managing both market risk and reward. My general bias remains cautious. And, "Don't Fight The Fed" remains in force, and if the Fed begins the process of a relative de-leveraging of the markets compared to what it has been doing, it must proceed very smoothly, and very cautiously about what it takes away, and when and how. And I wouldn't want to be on the wrong side of poor market reaction.
One way to employ such a straddle would be to utilize the S&P500 SPY ETF, by setting up an advanced trade technology approach (see "On-Off-Through Vector Target Price Switch") to position and 'hedge insurance' position management, with appropriate dynamic triggers and stops included -- for example, at SPY ETF $435.50.
To perform the short side of the straddle, set a short trigger below $435.50 on the SPY pre-programmed as a "repeating short trigger switch" at this trigger level on reverse downtick action through the trigger price, with stops set to activate on reverse uptick up-through action. To perform the long side of the straddle, set a long trigger above $435.50 pre-programmed as a "repeating long trigger switch" on reverse uptick action through the trigger, with stops set to activate on reverse downtick down-through action.
I would continue to closely watch the 2-year congressional cycle echovector, the annual cycle echovector, and each of the inclusive and key subsumptive cycle echovectors (biquarterly, quarterly, bimonthly, monthly, weekly, etc.), for continued symmetries and confirming parallels and early divergent tells. And, as always, I would keep calculating my echovector pivot points and employing my dynamic OTAPS On-Off-Through Vector Target Application Price Switch triggers as well.
This way you won't be fighting the Fed, or 'behind the curve' either; and will, in fact, be letting the Fed, and the market, help point you in the direction you 'should be facing.' And in this important month of March 2022, with all the US market is facing, and the global markets as well, such an approach would seem particularly timely and apropos.
I hope you have find this article interesting, and its observations useful forward. Thank you.
TO ENLARGE AND FURTHER ZOOM 'TODAY'S TOMORROW TRADER'S EDGE' PIVOT POINT INDICATOR FOCUS FORECAST FRAMECHART SNAPSHOTS
(1) RIGHT CLICK ON THE PROVIDED SNAPSHOT AND 'OPEN IMAGE IN NEW TAB, AND THEN LEFT CLICK ON THE PLUS MAGNIFIER, OR
(2) LEFT CLICK ON THE PROVIDED SNAPSHOT LINK, THEN LEFT CLICK ON THE SNAPSHOT TO ENLARGE, THEN RIGHT CLICK TO FIND 'OPEN IMAGE IN NEW TAB' AND LEFT CLICK, THEN LEFT CLICK THE ZOOM MAGNIFIER.
MDPP PRECISION PIVOTS GLOBAL FINANCIAL MARKETS LABORATORY
______________________________________________________________
ADDENDUM: NOMENCLATURE AND METHODOLOGY NOTES
PIVOT POINT CALCULATION AND CONSTRUCTION SESSION
ILLUSTRATING THE TIME CYCLE PIVOT POINT INDICATORS AND THEIR KEY SREV CFEV 'S AND R' SUPPORT/RESISTANCE PIVOT POINT PRICE PROJECTION VECTORS
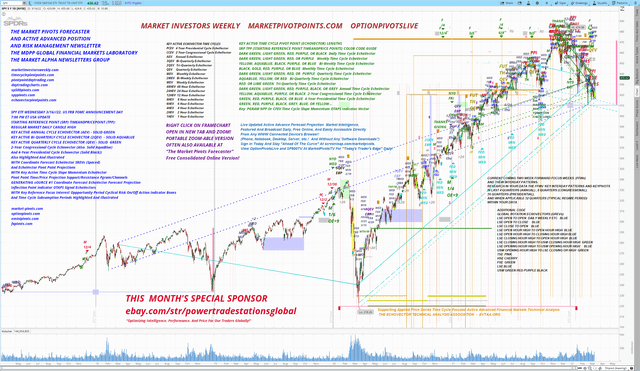
S&P500 SPY ETF PIVOT POINTS INDICATOR - ANNUAL AND SUBSUMPTIVE TIME CYCLE PIVOT POINTS IMPLICATIONS (EG., QUARTERLY, MONTHLY, ETC.) AND THEIR ASSOCIATED ECHOBACKPERIODS AND COORDINATE FORECAST SUPPORT AND RESISTANCE VECTORS (CFEVs, SREVs) HIGHLIGHTED AND ILLUSTRATED - DAILY CANDLES
PRESENTED BY THE PRECISION PIVOTS GLOBAL FINANCIAL MARKETS LABORATORY!
================================================

ECHOVECTOR TECHNICAL ANALYSIS ASSOCIATION - EVTAA.COM
THE TIME CYCLE PRICE (SLOPE) MOMENTUM ECHOVECTOR AND ECHOVECTOR PIVOT POINT PRICE PROJECTION PARALLELOGRAM:
POWERFUL TECHNICAL ANALYSIS FORECAST PROJECTION TOOLS:
ECHOVECTOR XEV OF TIME CYCLE LENGTH X With SRP-TPP (LOCATED ON FAR RIGHT) And EBD-TPP (LOCATED ON FAR FAR LEFT).
XEV - ECHOVECTOR OF TIME CYCLE LENGTH X
SRP - STARTING REFERENCE POINT (IN CURRENT FOCUS DAY)
TPP - TIMEANDPRICEPOINT (IN CURRENT FOCUS DAY & EBD)
EBD - ECHOBACKDATE (SAME DAY OF WEEK, X TIME CYCLE LENGTH BACK)
EchoVector of cyclical time period length X, with starting timeandpricepoint SRP-TPP (to the far right) and echobackdate timeandpricepoint EBD-TPP (to the far left).
SRP-TPP is a forward reflection of EBD-TPP, only located one cyclical time period length 'X' forward (such as one Quarter forward in a Q-EV). XEV's slope momentum (change, slopemo) in cyclical time period length X measures the price difference between EBD-TPP and SRP-TPP over that specific cyclical time length X period.
XEV is the hypotenuse of triangle time length X (horizontal) and price points P differential (vertical) where the price point differential is the price difference between the EBD-TPP and the SRP-TPP.
A CFEV (Coordinate Forecast EchoVector) generated from EchoVector XEV runs parallel to XEV and radiates from a scalar NPP (nearby pivot point, nearby inflection point) occurring forward from XEV's EBD-TPP located in the EBP (echobackperiod).
At the far right end of the CFEV is found the EVPPPP (EchoVector Pivot Point Price Projection (S1, S2, S3, S4, R1, R2, R3, R4, etc.) to XEV's SRP-TPP.
This full construction is called the 'Time Cycle Price (Slope) Momentum EchoVector Pivot Point Price Projection Parallelogram, containing XEV's SRP-TPP, Xev'S EBD-TPP, the NPP-TPP located forward from the EBD-TPP and serving as XEV's CFEV origin, and the EVPPPP-TPP found at the far right of the CFEV.
The CFEV is a powerfully indicative EVA Support/Resistance vector! The powerful TCPSMPPPPPgram, with its identified and defining XEV SRP-TPP, and its EBP (echobackperiod) identified and constructed CFEV, radiating from the NPP-TPPs to the EVPPPP-TPPs, (S1, S2, S3, S4, R1, R2, R3, R4, etc.), is thereby constructed.
XEV SRP-TPP/EBD-TPP/NPP-TPP/EVPPPP-TPP (Sn Or Rn)
----------------------------------------------------------------------------------------
Disclosure: I/we have no stock, option or similar derivative position in any of the companies mentioned, but may initiate a beneficial Short position through short-selling of the stock, or purchase of put options or similar derivatives in SPY over the next 72 hours.
I wrote this article myself, and it expresses my own opinions. I am not receiving compensation for it. I have no business relationship with any company whose stock is mentioned in this article.
DISCLAIMER: This post is for educational and informational purposes only. There can be significant risks involved with investing including loss of principal. There is no guarantee that the goals or the strategies and examples discussed will be achieved. NO content published by us on the Site, our Blogs, Newsletters, and any Social Media we engage in constitutes a recommendation that any particular investment strategy, security, portfolio of securities, or transaction is suitable for any specific person. Further understand that none of our bloggers, information providers, App providers, or their affiliates are advising you personally concerning the nature, potential, value or suitability of any particular security, portfolio of securities, transaction, investment strategy or other matter. Again, this post is for educational, informational, and entertainment purposes only. BEFORE MAKING ANY INVESTMENT DECISIONS WE STRONGLY ENCOURAGE YOU TO FIRST CONSULT WITH YOUR PERSONAL FINANCIAL ADVISER.
© 2024 Benzinga.com. Benzinga does not provide investment advice. All rights reserved.
Trade confidently with insights and alerts from analyst ratings, free reports and breaking news that affects the stocks you care about.

