


Political events have the potential to cause big moves in the stock market. However, there is no way to predict the outcome of such events or which direction the market will go.
A different way to play a political event is volatility. If you expect a large move in the stock market, options can allow you to set up a volatility trade.
We are days away from a presidential election. The markets are very keen on the election aftermath because this can determine future economic policy. Some industries will stand to benefit while others will surely suffer. There is also fear that a close election can result in an extended legal battle creating unprecedented uncertainty. Uncertainty is the driving force behind market volatility.
To fuel even more uncertainty, the coronavirus stimulus package outcome has yet to be decided and passed. The package is badly needed to support our economic recovery. However, too many unanswered questions remain and the future is sadly unknown. When will the bill pass? What will be in it?
With so much instability and variability in our political spectrum, it becomes very difficult to formulate an opinion and/or make a statistically advantageous decision on the direction the market is going.
In such an environment, traders can consider another trade that eliminates the directional risk while giving you the chance to profit from a big move in the market (whether the market goes up or down).
How To Play The Markets Movement
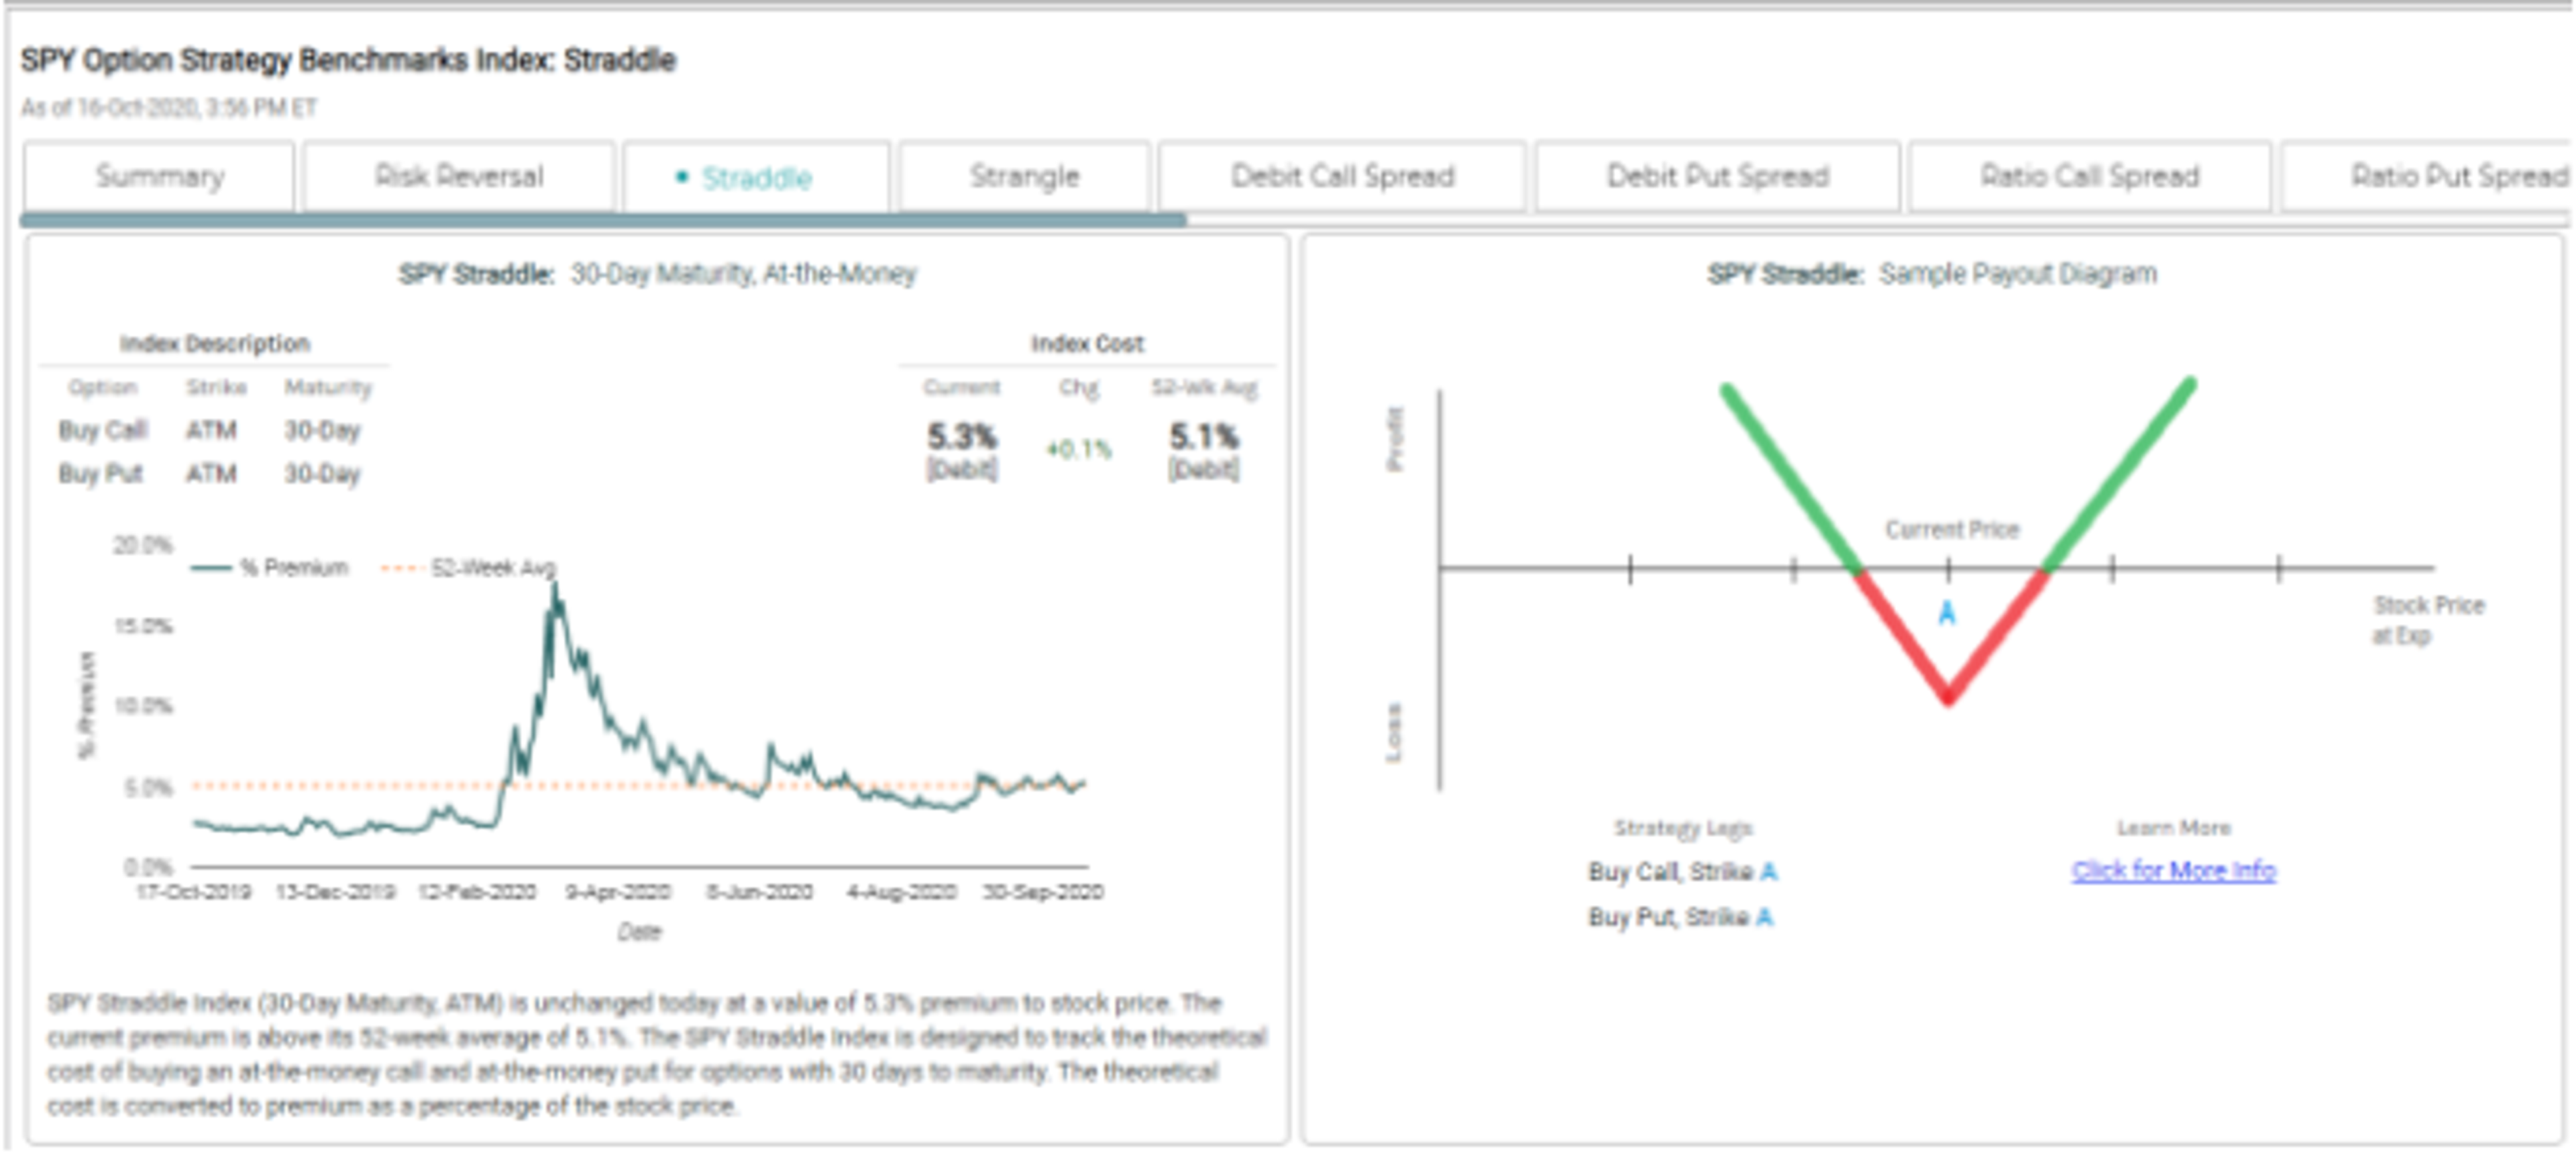
When you buy a call option you want the market to go up. When you buy a put option you want the market to go down. Both are directional trades. But when you combine them, you just want a large move, up or down, in the stock market. This options strategy is known as the straddle and it is a non-directional trade. Since you have both a call and put option, it no longer matters what direction the stock goes, as long as the underlying stock moves up or down by a greater amount than the total cost of purchasing the put and call options. To help you visualize your profit and loss from a straddle, see the chart below.

Source: Market Chameleon
In this example, you have 2 charts to reference. The chart on the right side shows you an example payout diagram of a straddle at expiration. You can see that you can profit to the upside or downside, if the stock moves far enough to cover the cost of the straddle. This is why the chart is shaped like a V.
Benchmark The Straddle
On the left-hand side, you see a historical chart of what the straddle costs. To gauge if the straddle is expensive or cheap, we need something to compare it or a benchmark. You can compare the current cost 5.2% (the premium to the underlying stock price) to a 52-week average to get an idea how much above or below you would be paying from what it typically costs. In this case the average is 5.1%, which is pretty close to its 52-week average. With a potential market-moving political event on the horizon, it would seem like a pretty good deal!
Bonus: One More Strategy
I would like to show you another volatility strategy called the Debit Butterfly. It starts out the same as buying a straddle, but in addition, you would sell an out-of-the-money put and out-of-the-money call. You do this to help finance some of the cost of the straddle. In this case, you limit your potential gains but you reduce your cost (less risk) and the stock does not need to move as much to profit as a straddle.
How do you find a butterfly strategy? First, I use a scan to help find a butterfly strategy that offers an opportunity with a historically high win rate. The MarketChameleon scan will analyze different combinations of option legs against historical stock behavior to construct opportunities with the most potential. This way we can use data, statistics, and technology to increase our odds of success and perform the difficult task of finding the opportunities so I can quickly make the decision of which strategy falls in line with my goals. Here is an example of a trade opportunity in SPY that was found using MarketChameleon.com trade cards.

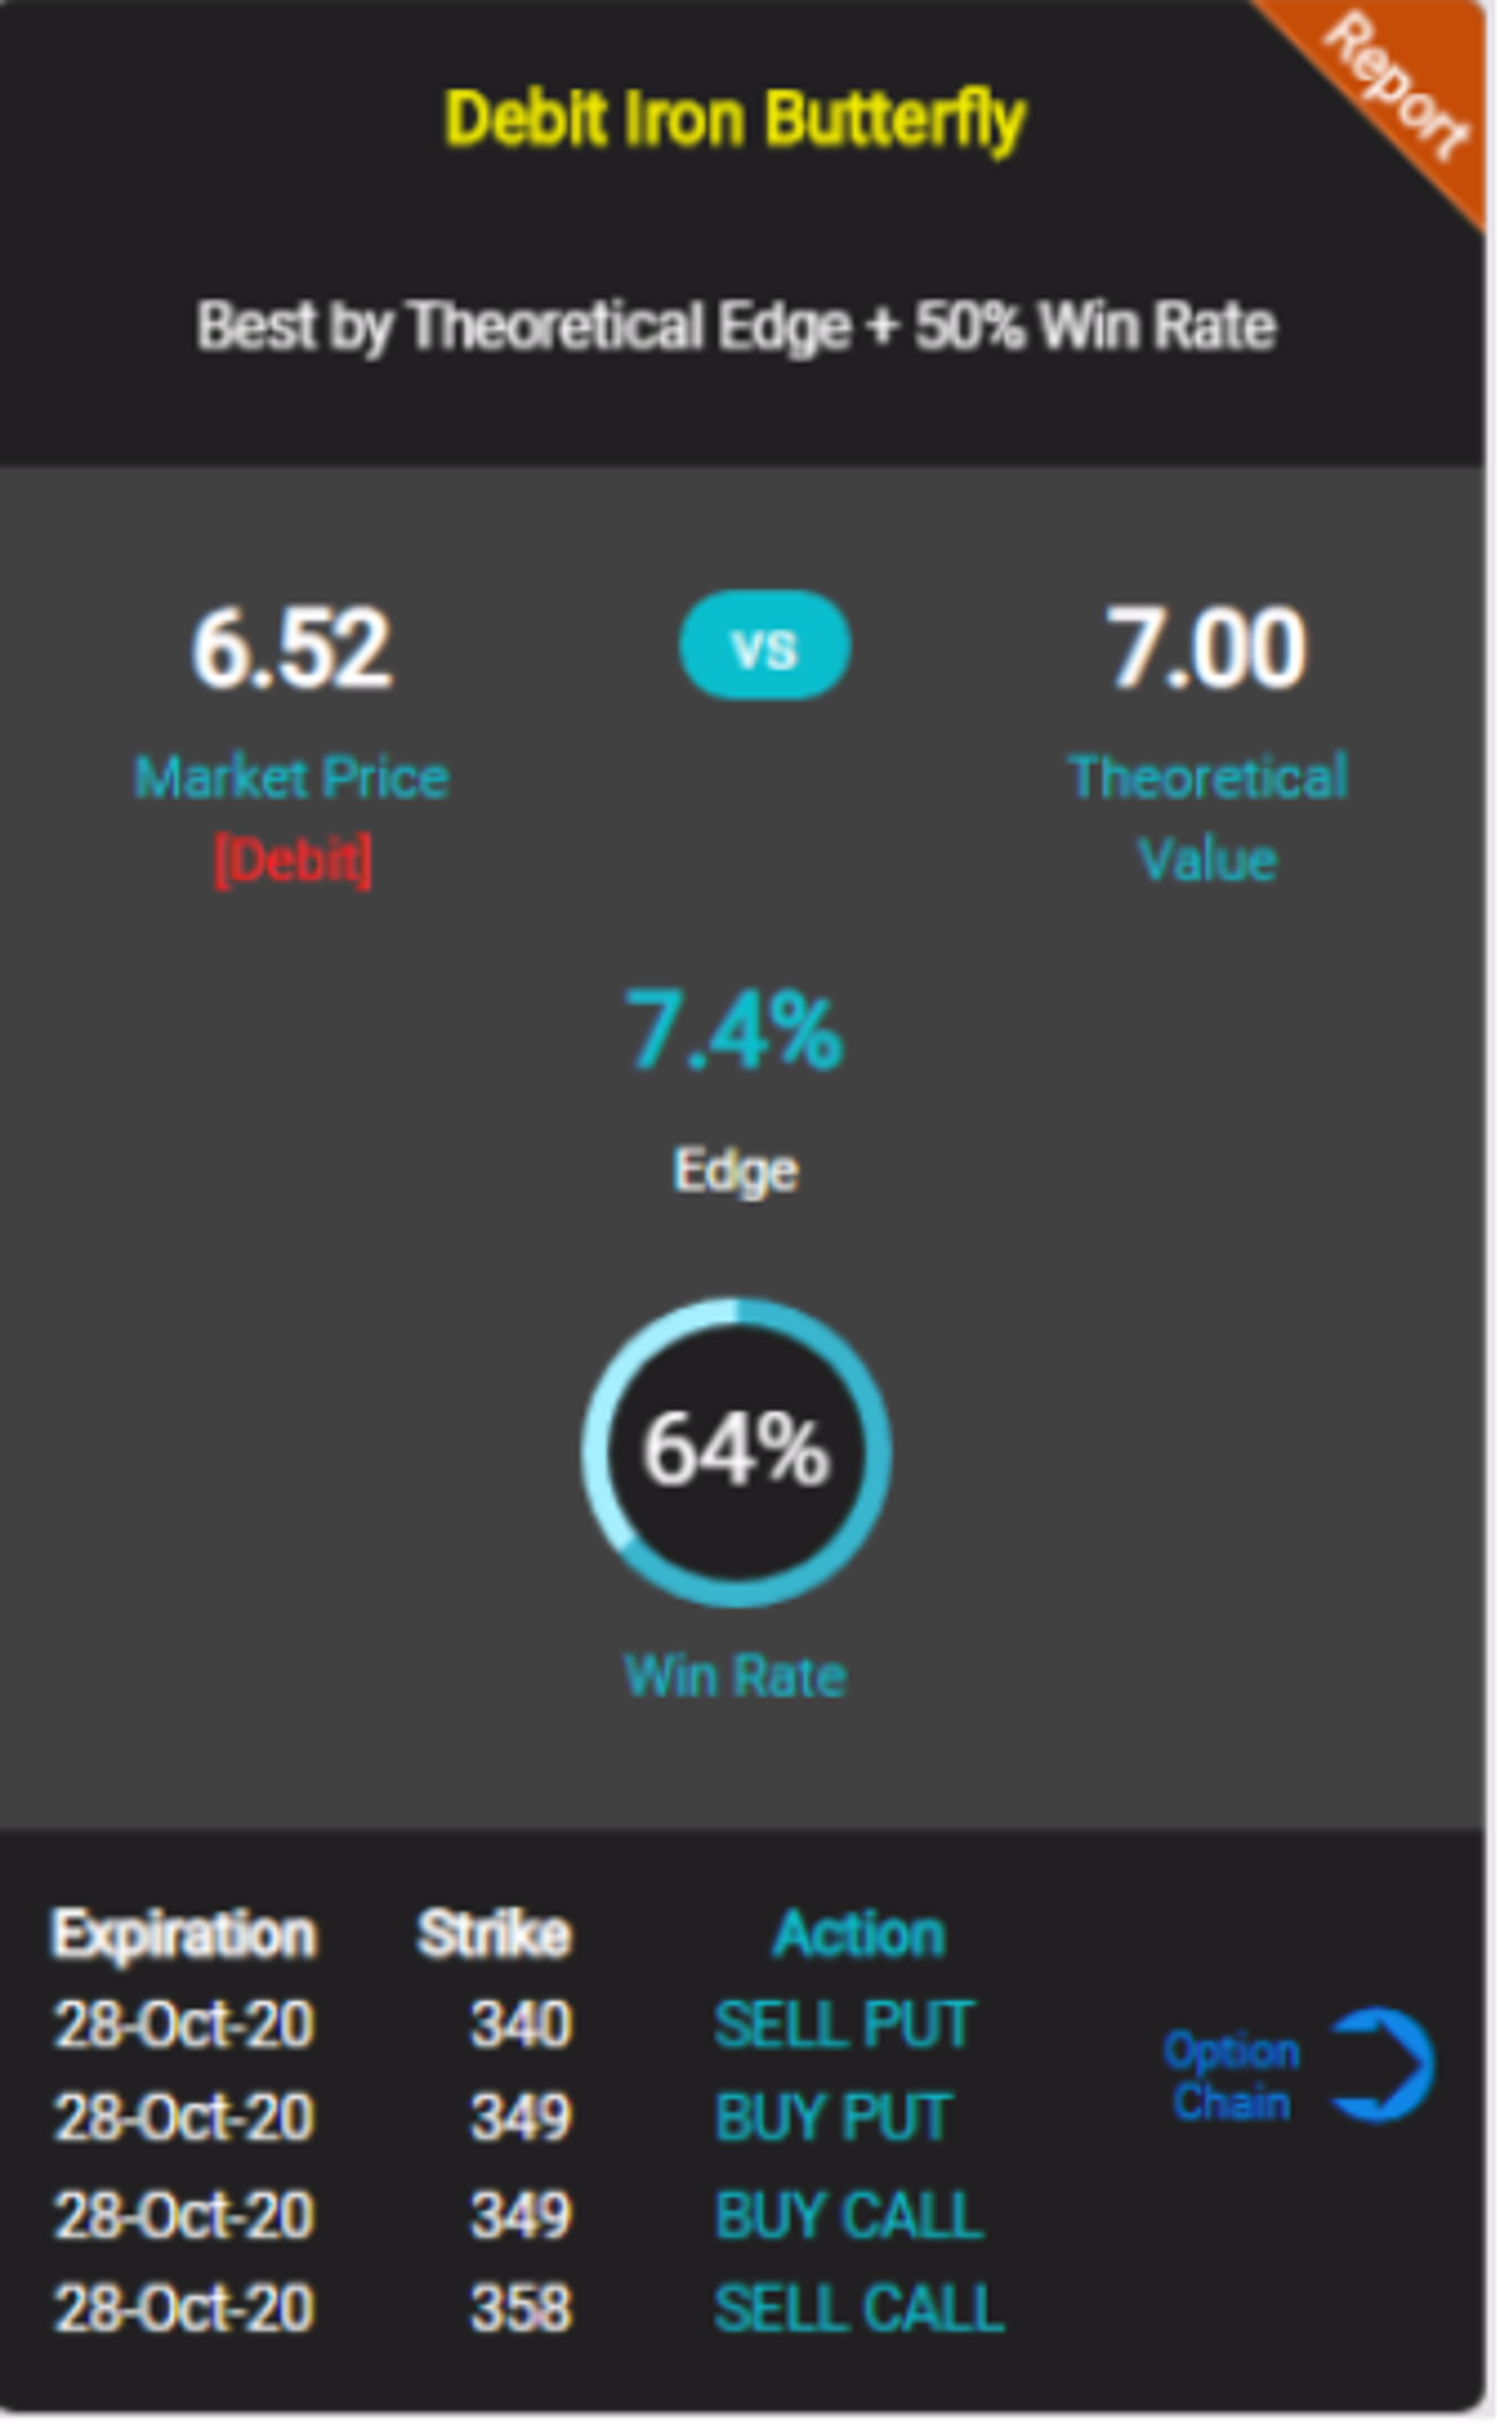
In this trade card it filtered the butterfly strategy of buying the atm money straddle (buying the call and put on the 349 strike) and selling a 340 strike put and selling a 358 strike call option. In this snapshot in time, the butterfly would cost $6.52. Based on SPY historical stock behavior the theoretical value of the strategy is $7 resulting in a theoretical edge of 7.4%. The historical probability of profit for this opportunity is 64%.
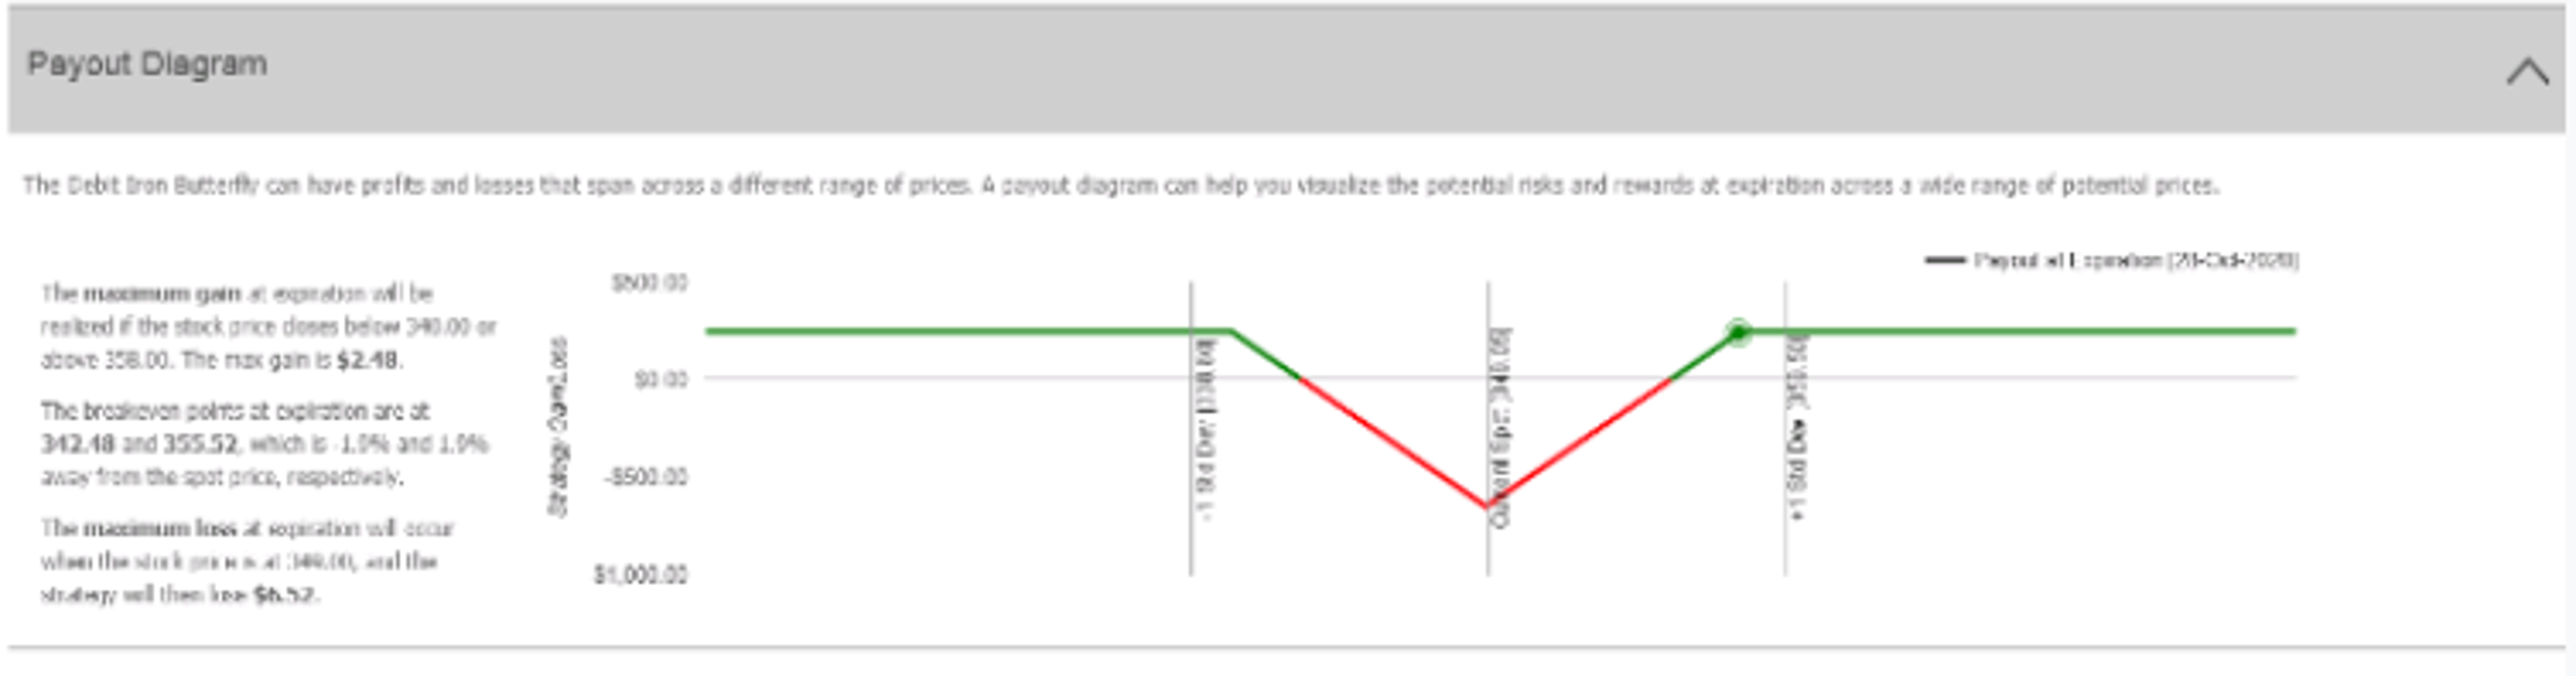
When I go to the detailed Report of the trade card I can see important information that will help me make my decision. Below is a screenshot of the payout diagram in the detailed report, with the break-even points, max gains and max losses. As you can see, the profit is limited, but in turn, the risk has been reduced relative to a straddle.

Main Takeaway
If you are looking to trade around an event, such as the Presidential Election and/or Stimulus package, but you don't have a directional bias, options can provide a way to play stock market moves in either direction.
© 2024 Benzinga.com. Benzinga does not provide investment advice. All rights reserved.
Trade confidently with insights and alerts from analyst ratings, free reports and breaking news that affects the stocks you care about.

