


With more and more trading platforms and the growing allure of low-to-no-fee brokerages, new traders are confronted with a deluge of options when it comes to trading and investing. But lost in the promises of sleek interfaces and free shares for signing up is the fact that successful trading takes time, practice and an understanding of resources experienced traders use on a daily basis.
With that in mind, we’re going to use this new series of articles to take a look at the charts, ratios and indicators that play an integral role in how traders generate ideas and form convictions on their medium- or short-term trades. To do that, we’ll be using the charts and tools available on the Webull trading app, which offers traders access to real, zero-commission trading in addition to a suite of advanced trading analysis and charting.
Being a successful trader is all about strategy. And although one successful strategy may differ from another in terms of timeframe, trading signals, risk profile and countless other factors, one thing that is generally consistent for every trader is the desire to buy or sell a stock at the best possible time.
Although some might consider market orders (orders to buy or sell shares of a stock immediately without concern for the price) as a counterexample of this principle, few traders who place a market order would be especially pleased if they found they had bought in just after another large buyer drove up the price, or a large sell order undercut their own sale.
One advanced technique traders utilize in order to strategize their exact entry is “tape reading,” or analyzing individual transactions to determine when might be their best opportunity to place an order on a stock to get the best deal possible. While “tape reading” is a bit of an anachronism, referring to when the stock transactions were printed out on ticker tape, there is a modern-day equivalent in the form of time and sales information.
For a quick primer, let’s take a look at the time in sales for Uber Inc. UBER in the last few minutes before the market closed on the day it was to report earnings.
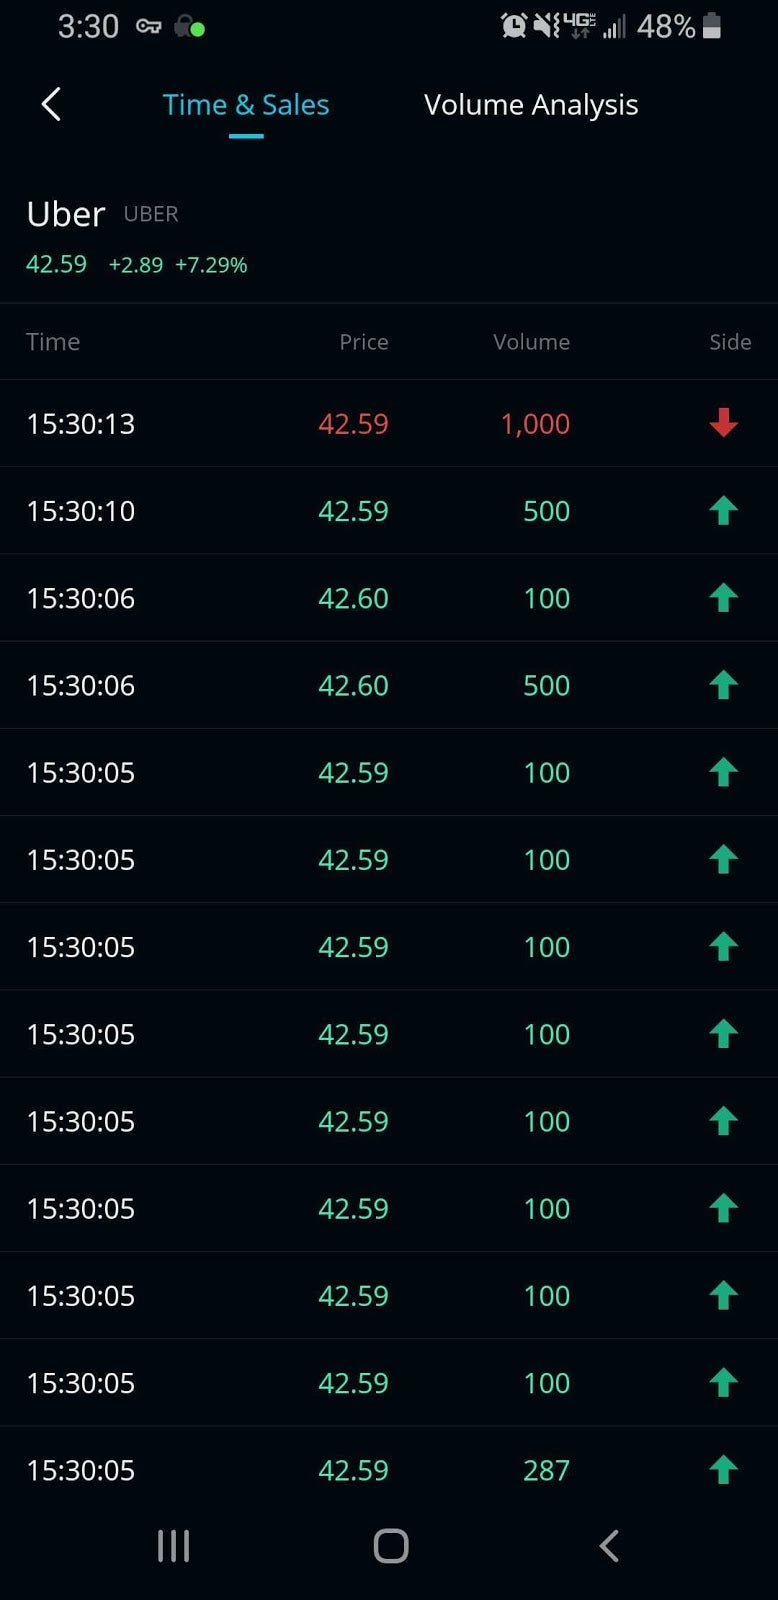
That’s a lot of activity. However, in all of those transactions are potential trading signals that, alongside other information, traders are using to plot when the best time to buy and sell might be.
For example, someone looking to buy and hold Uber expecting an earnings beat might be looking for something like that 1000 share sale at the top to spur more sales and drive down the price. That way, he or she might be able to get a discount in the moment.
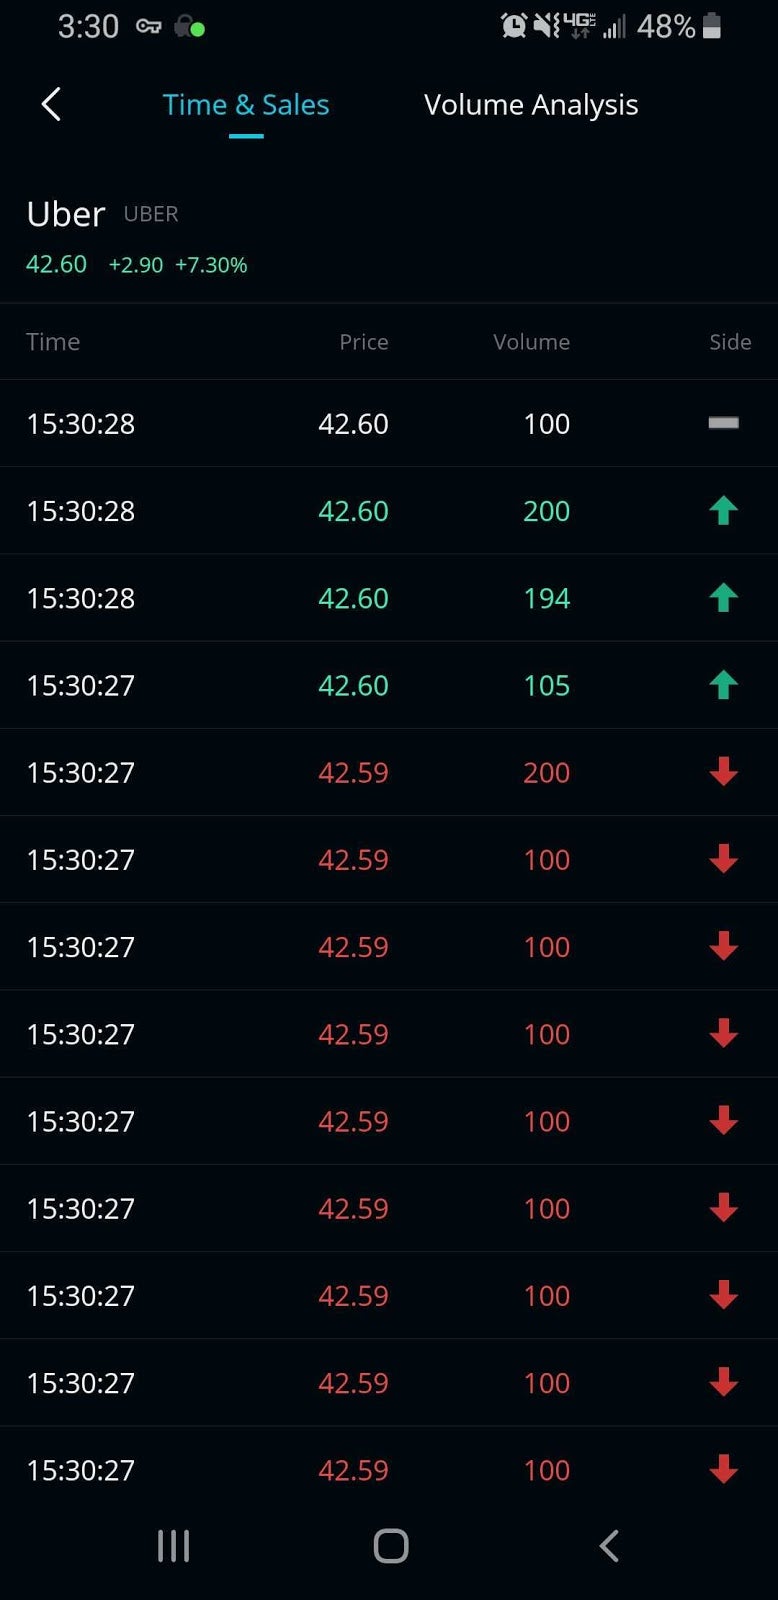
On the other hand, someone looking to make a quick scalp trade might be looking for something like the pattern below, which shows a shift from heavy selling to a buying streak. Once that pattern shifts again and the price hit a peak, that trader could then start taking profit.
Ultimately, the benefit of using time and sales to “read the tape” lies in the versatility of the information and the ways in which it can be interpreted. While not every trader will necessarily need to time their trades down to the second, understanding the impact of trader activity on your own trades can be an invaluable asset if you find yourself looking for a little extra insight before making a trade.
Webull is a content partner of Benzinga.
© 2024 Benzinga.com. Benzinga does not provide investment advice. All rights reserved.
Trade confidently with insights and alerts from analyst ratings, free reports and breaking news that affects the stocks you care about.

