


Few voices on Wall Street are more respected than that of Berkshire Hathaway, Inc. (NYSE: BRK-A)(NYSE: BRK-B) CEO Warren Buffett. When someone like Buffett refers to a market metric as “the best single measure of where valuations stand at any given moment,” investors take notice.
What Is The Buffett Indicator?
Buffett made the statement above about a metric called the market capitalization-to-GDP ratio. Buffett fans often refer to the ratio as the “Buffett indicator.”
The Buffett indicator is calculated by dividing the total value of all stocks in the U.S. market and by the gross domestic product of the U.S. Traders typically use the Wilshire 5000 Total Market Index as a measure of total U.S. market cap.
When Did Buffett Invent The Buffett Indicator?
The calculation of the market capitalization-to-GDP ratio is so simple and intuitive that Buffett certainly wasn’t the first or only investor to use it to gauge market valuations. His famous quote comes from a 2001 Forbes article in which Buffett discussed investing strategy.
The story included a long-term chart of the Buffett indicator such as the one below.

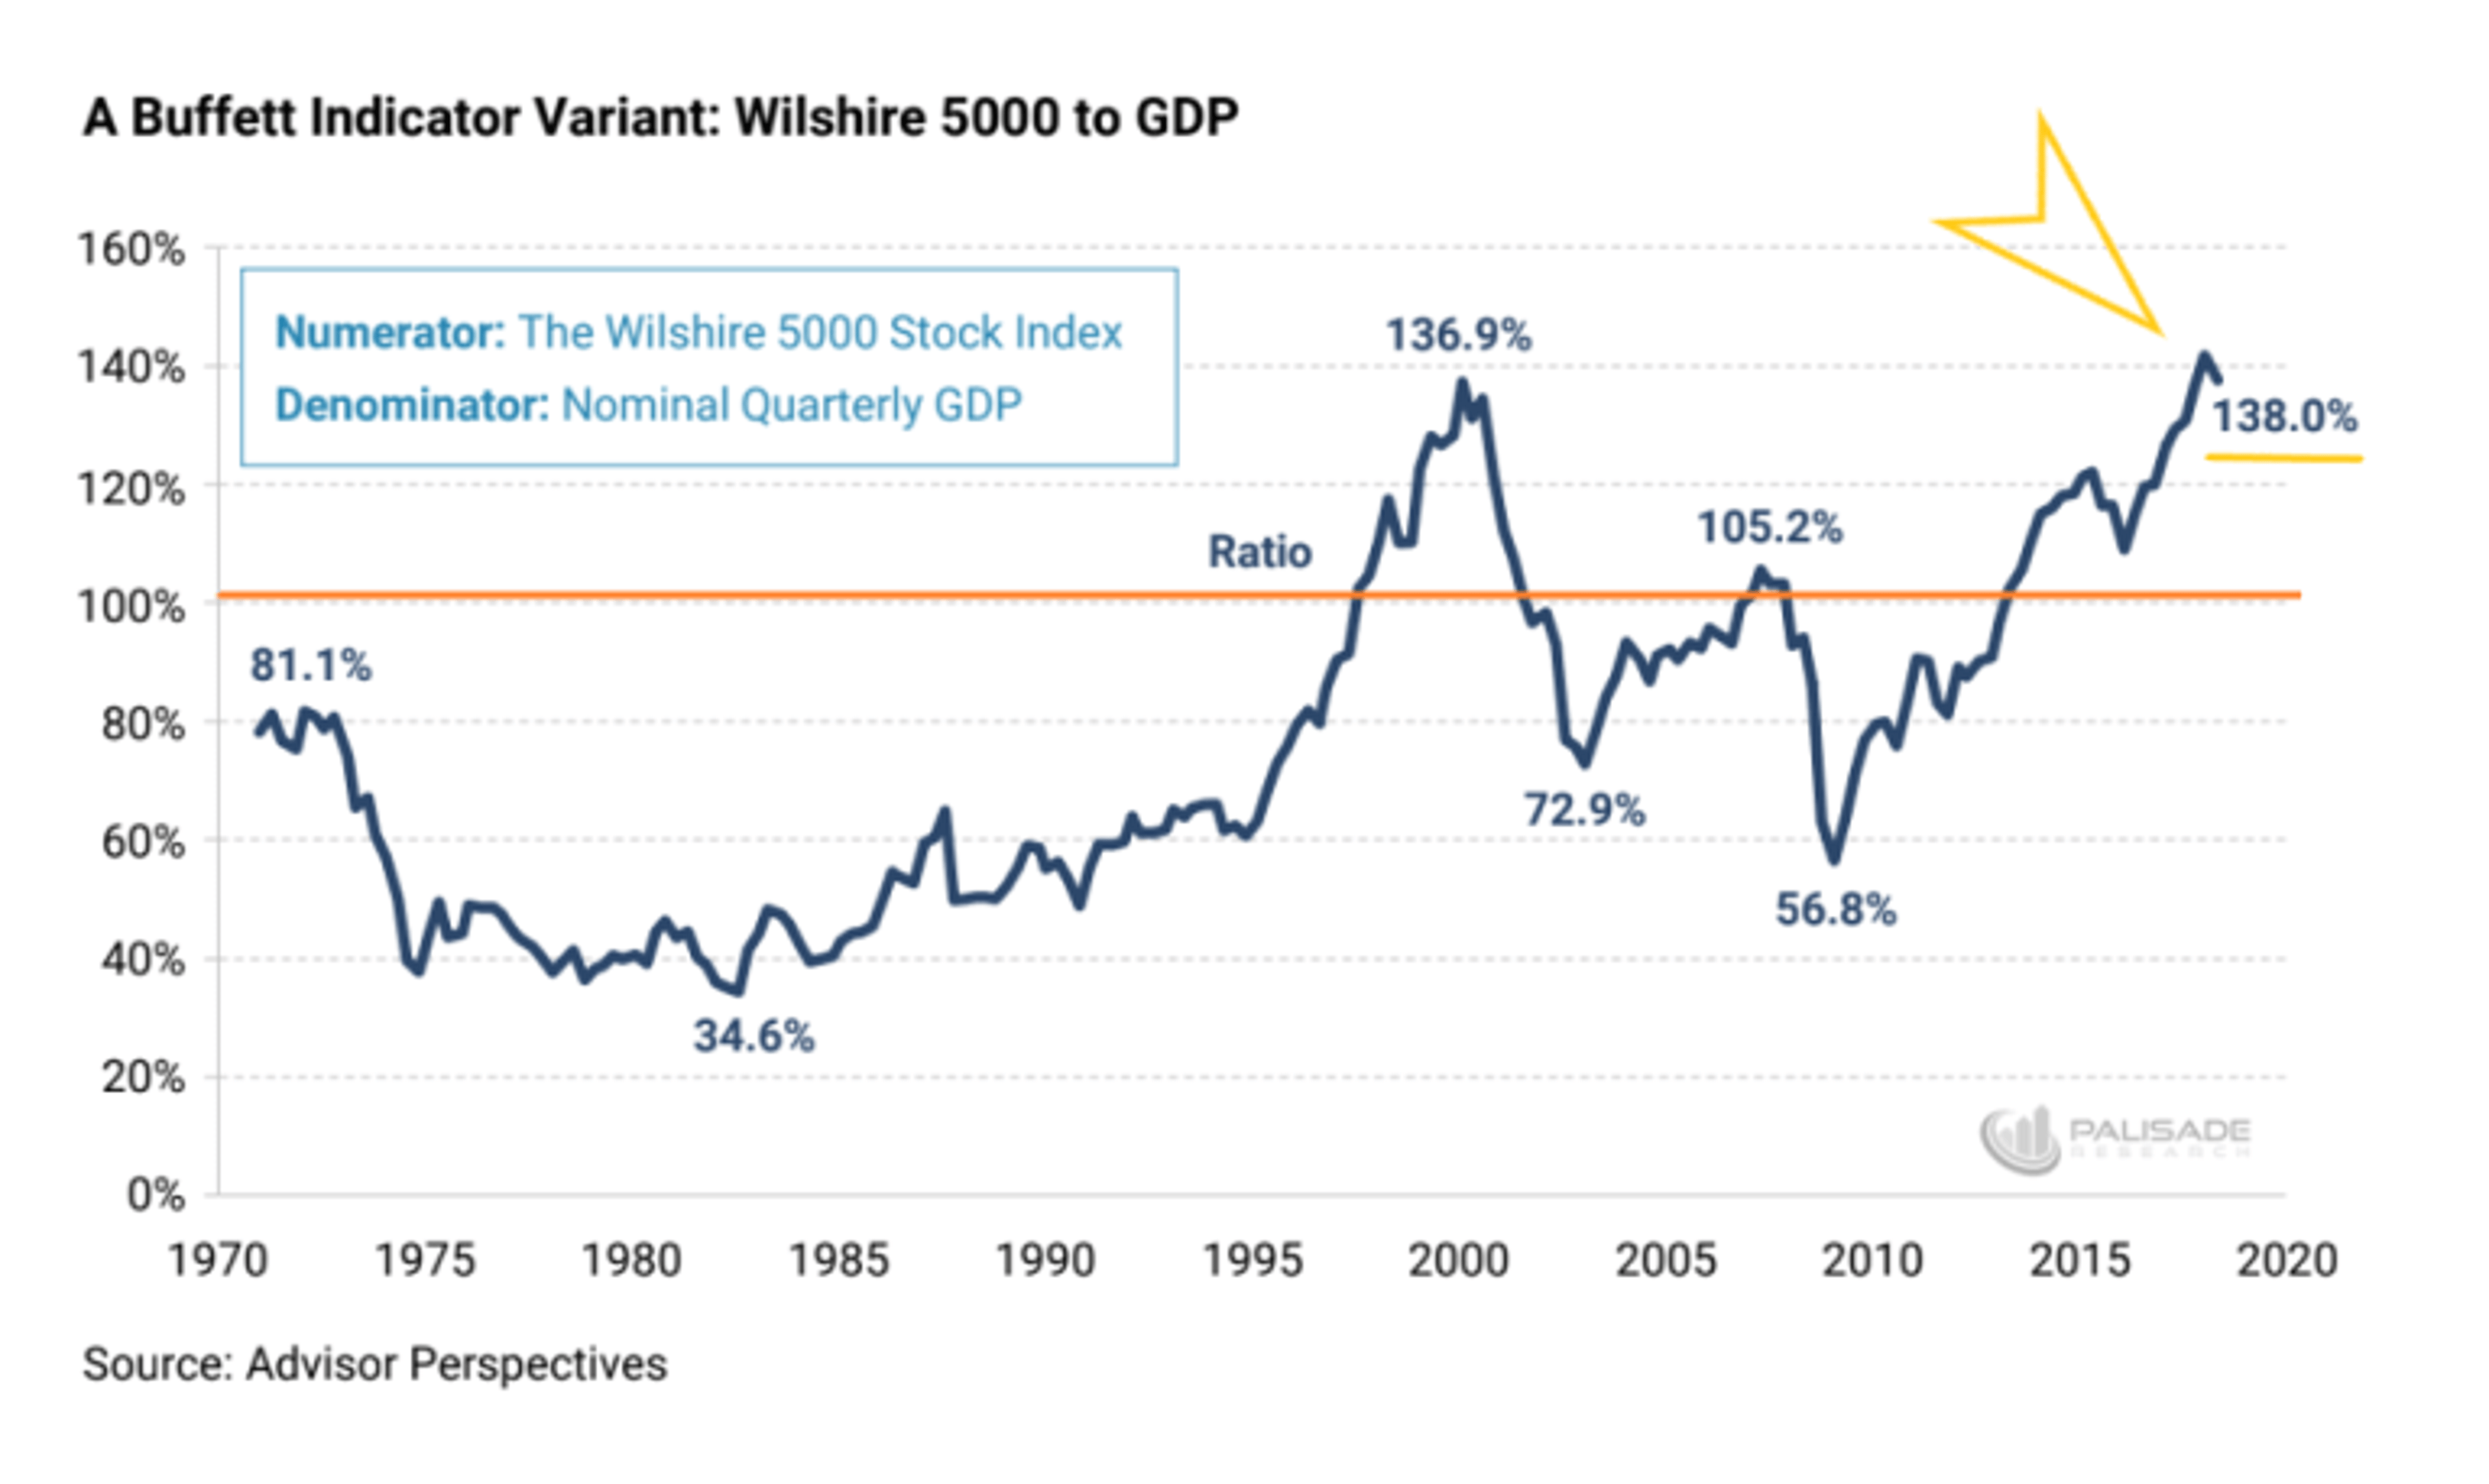
“The chart shows the market value of all publicly traded securities as a percentage of the country's business — that is, as a percentage of GNP,” Buffett said. “The ratio has certain limitations in telling you what you need to know. Still, it is probably the best single measure of where valuations stand at any given moment.”
How Has The Buffett Indicator Changed Over Time?
Historically, the Buffett indicator average has been around 65%. The ratio dipped below 30% several times throughout the Great Depression and then briefly in 1982. The ratio peaked at 88.3 prior to the market crash in 1929 and at 136.9 during the dot-com bubble in 2000. The ratio hit an all-time high earlier this week.
The Buffett Indicator has been above 100, a level often considered overvalued, for roughly eight years now. The only time the ratio dipped below 65 since 1995 was during the worst part of the financial crisis of 2008 and 2009.
How Could You Follow Warren Buffett's Career Path Nowadays?
Limitations
Unfortunately, the limitations Buffett mentioned back in 2001 mean the Buffett Indicator is limited in its utility. The indicator isn't a sign of an imminent market sell-off, as suggested by the fact it has been historically high for several years now.
So how should investors think about a Buffett indicator currently making an all-time high? Buffett addressed the indicator peak back in 2001.
“Nearly two years ago, the ratio rose to an unprecedented level. That should have been a very strong warning signal,” the CEO said.
Berkshire Hathaway CEO Warren Buffett with former President Barack Obama. White House photo by Pete Souza.
This Story Was Originally Published May 2, 2020
© 2024 Benzinga.com. Benzinga does not provide investment advice. All rights reserved.
Trade confidently with insights and alerts from analyst ratings, free reports and breaking news that affects the stocks you care about.

