


Now that many companies have reported Q2 earnings, Benzinga took a look at some of the largest, most popular tech companies in the world to determine how much value investors are getting from a share of stock at the current market price.
Here’s a breakdown of how Amazon.com, Inc. AMZN, Google Inc GOOG GOOGL, Facebook Inc FB, Apple Inc. AAPL and Netflix, Inc. NFLX look from a fundamental standpoint now that their latest quarterly financials are factored in.
Earnings
A price-to-earnings ratio (PE) is one of the most basic fundamental metrics for gauging a stock’s value. The lower the PE, the higher the value. Here’s how the current PEs for these five big names compare.

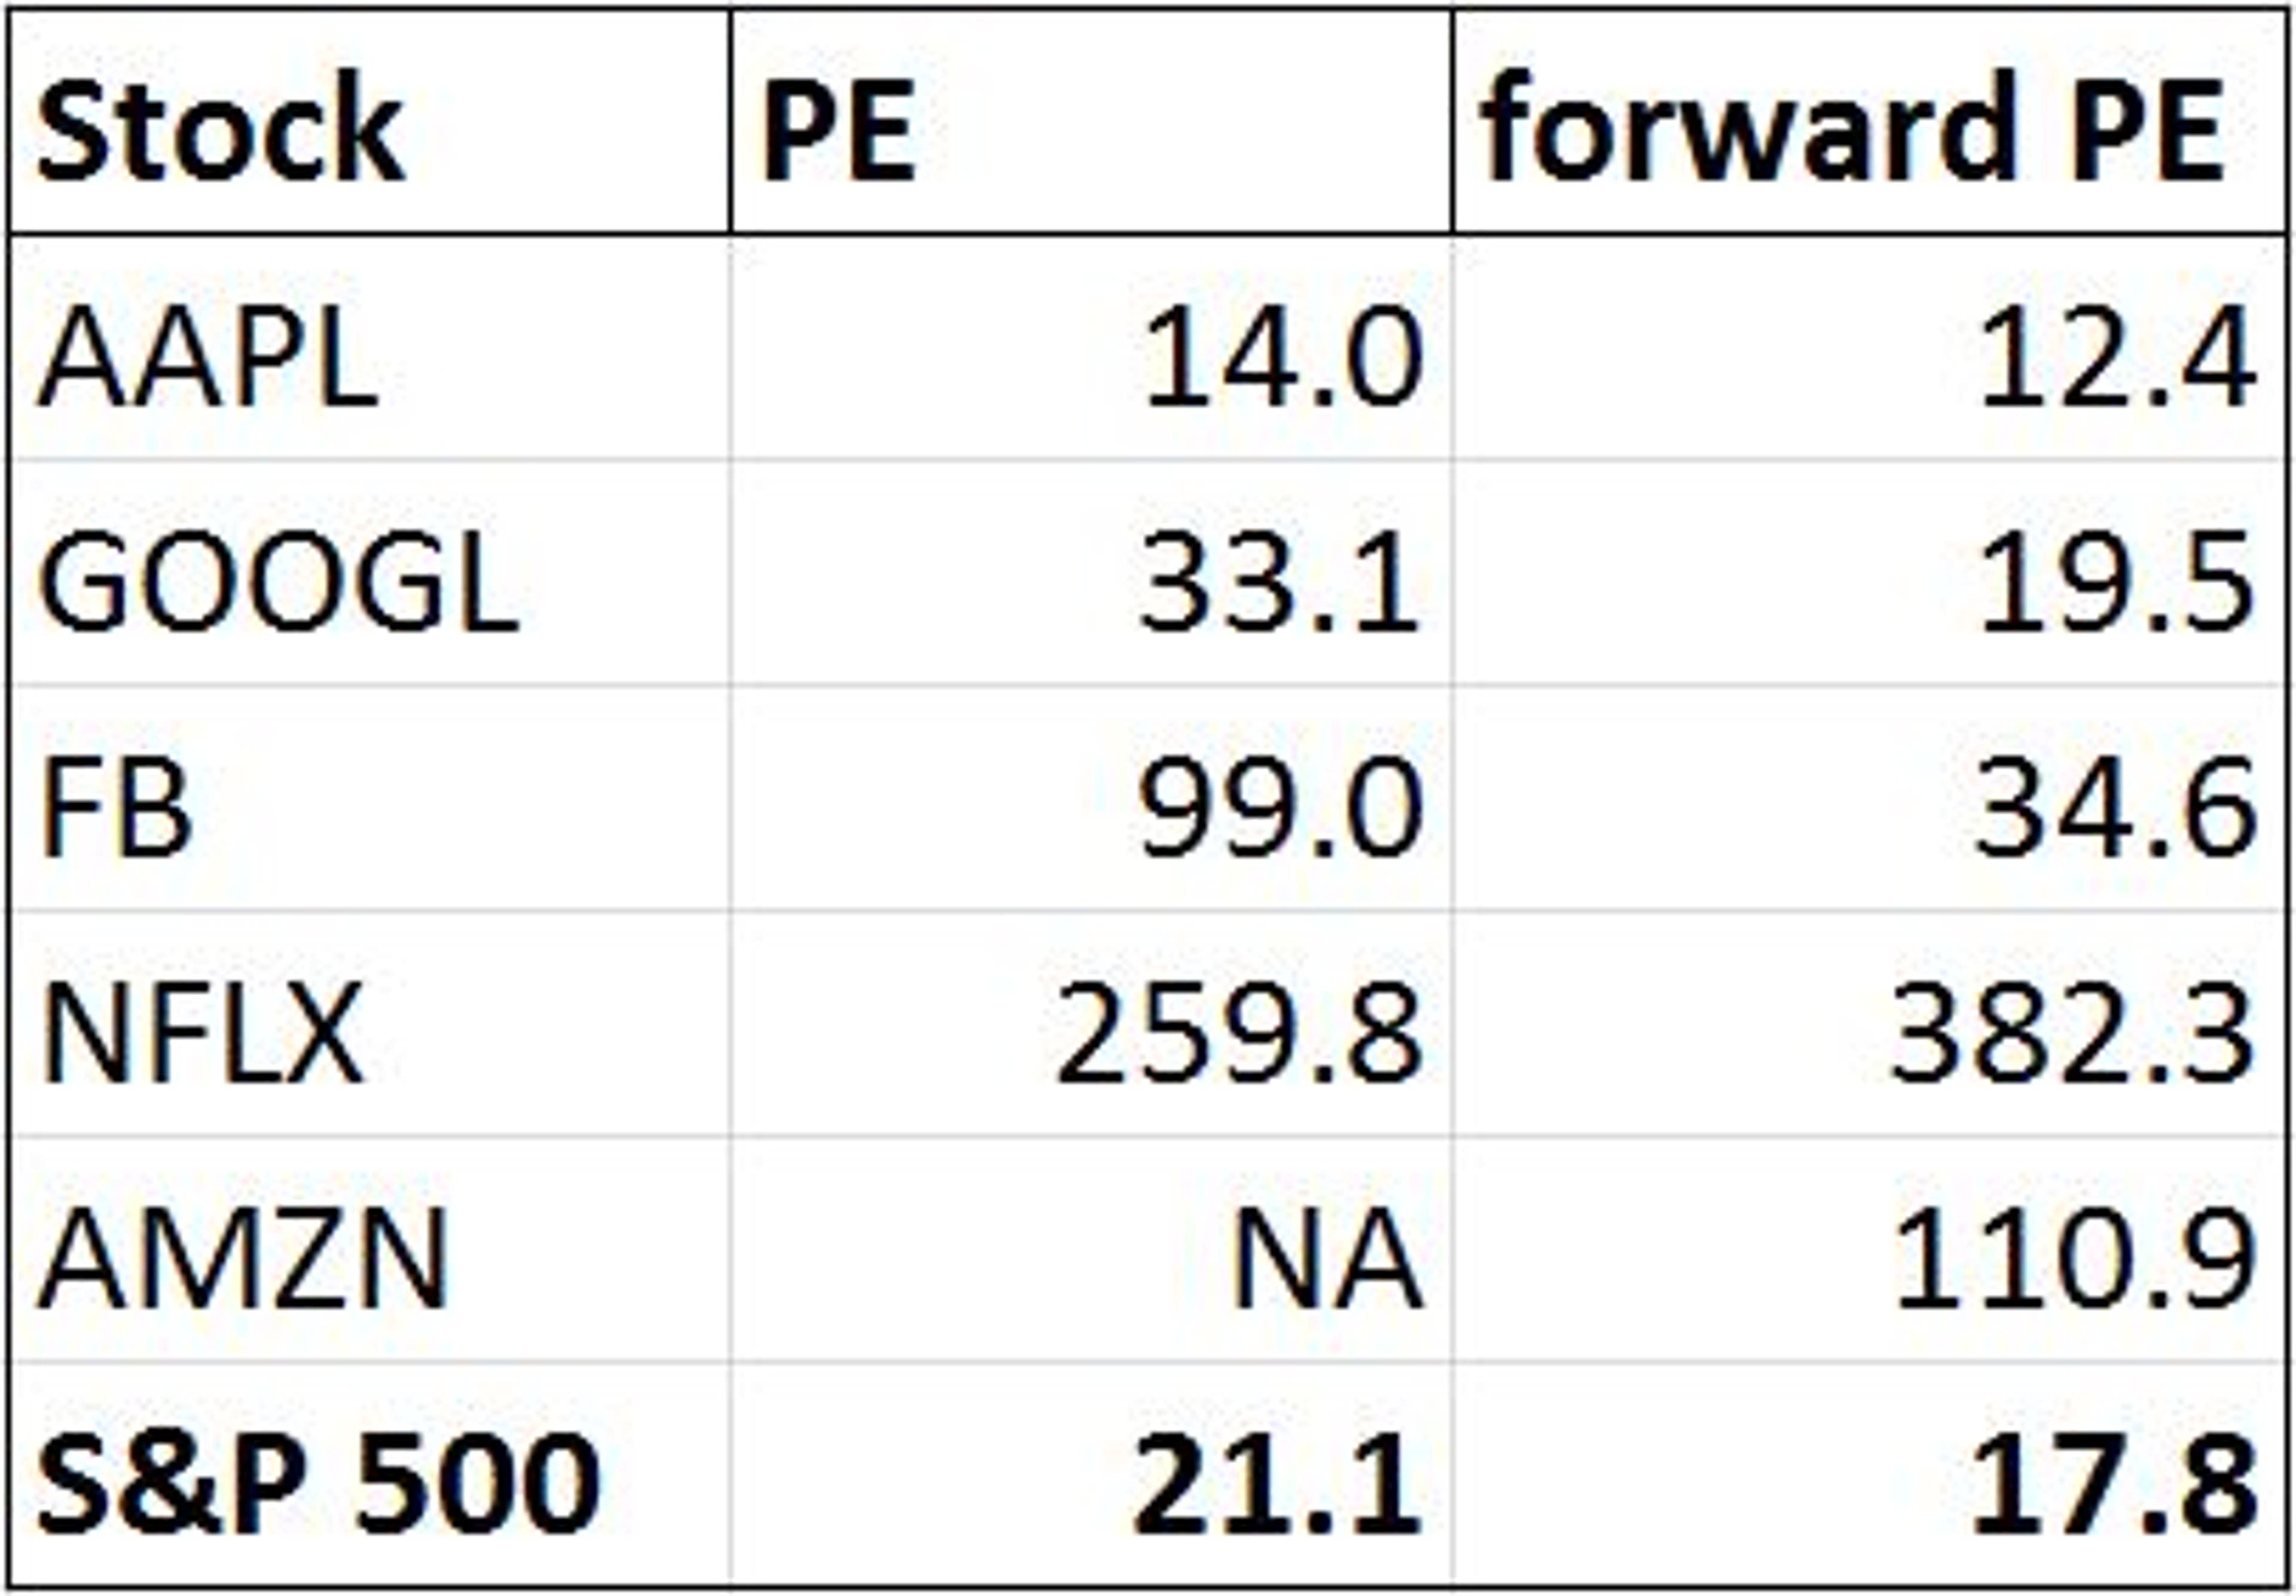
Apple is the only stock of the group with a PE lower than the S&P 500’s overall PE of 21.1. Facebook and Netflix’s PEs of over 90 are nowhere near the typical range. Amazon is the only company that was not profitable over the last four quarters (and therefore has no PE).
Growth
However, when it comes to evaluating a stock, price is not everything.
Growth rate is also critical for companies that are rapidly building their bottom lines. The price-to-earnings-to-growth ratio (PEG) is a good way to incorporate growth rates into the evaluation process. Here’s a comparison of the PEGs of these five names.
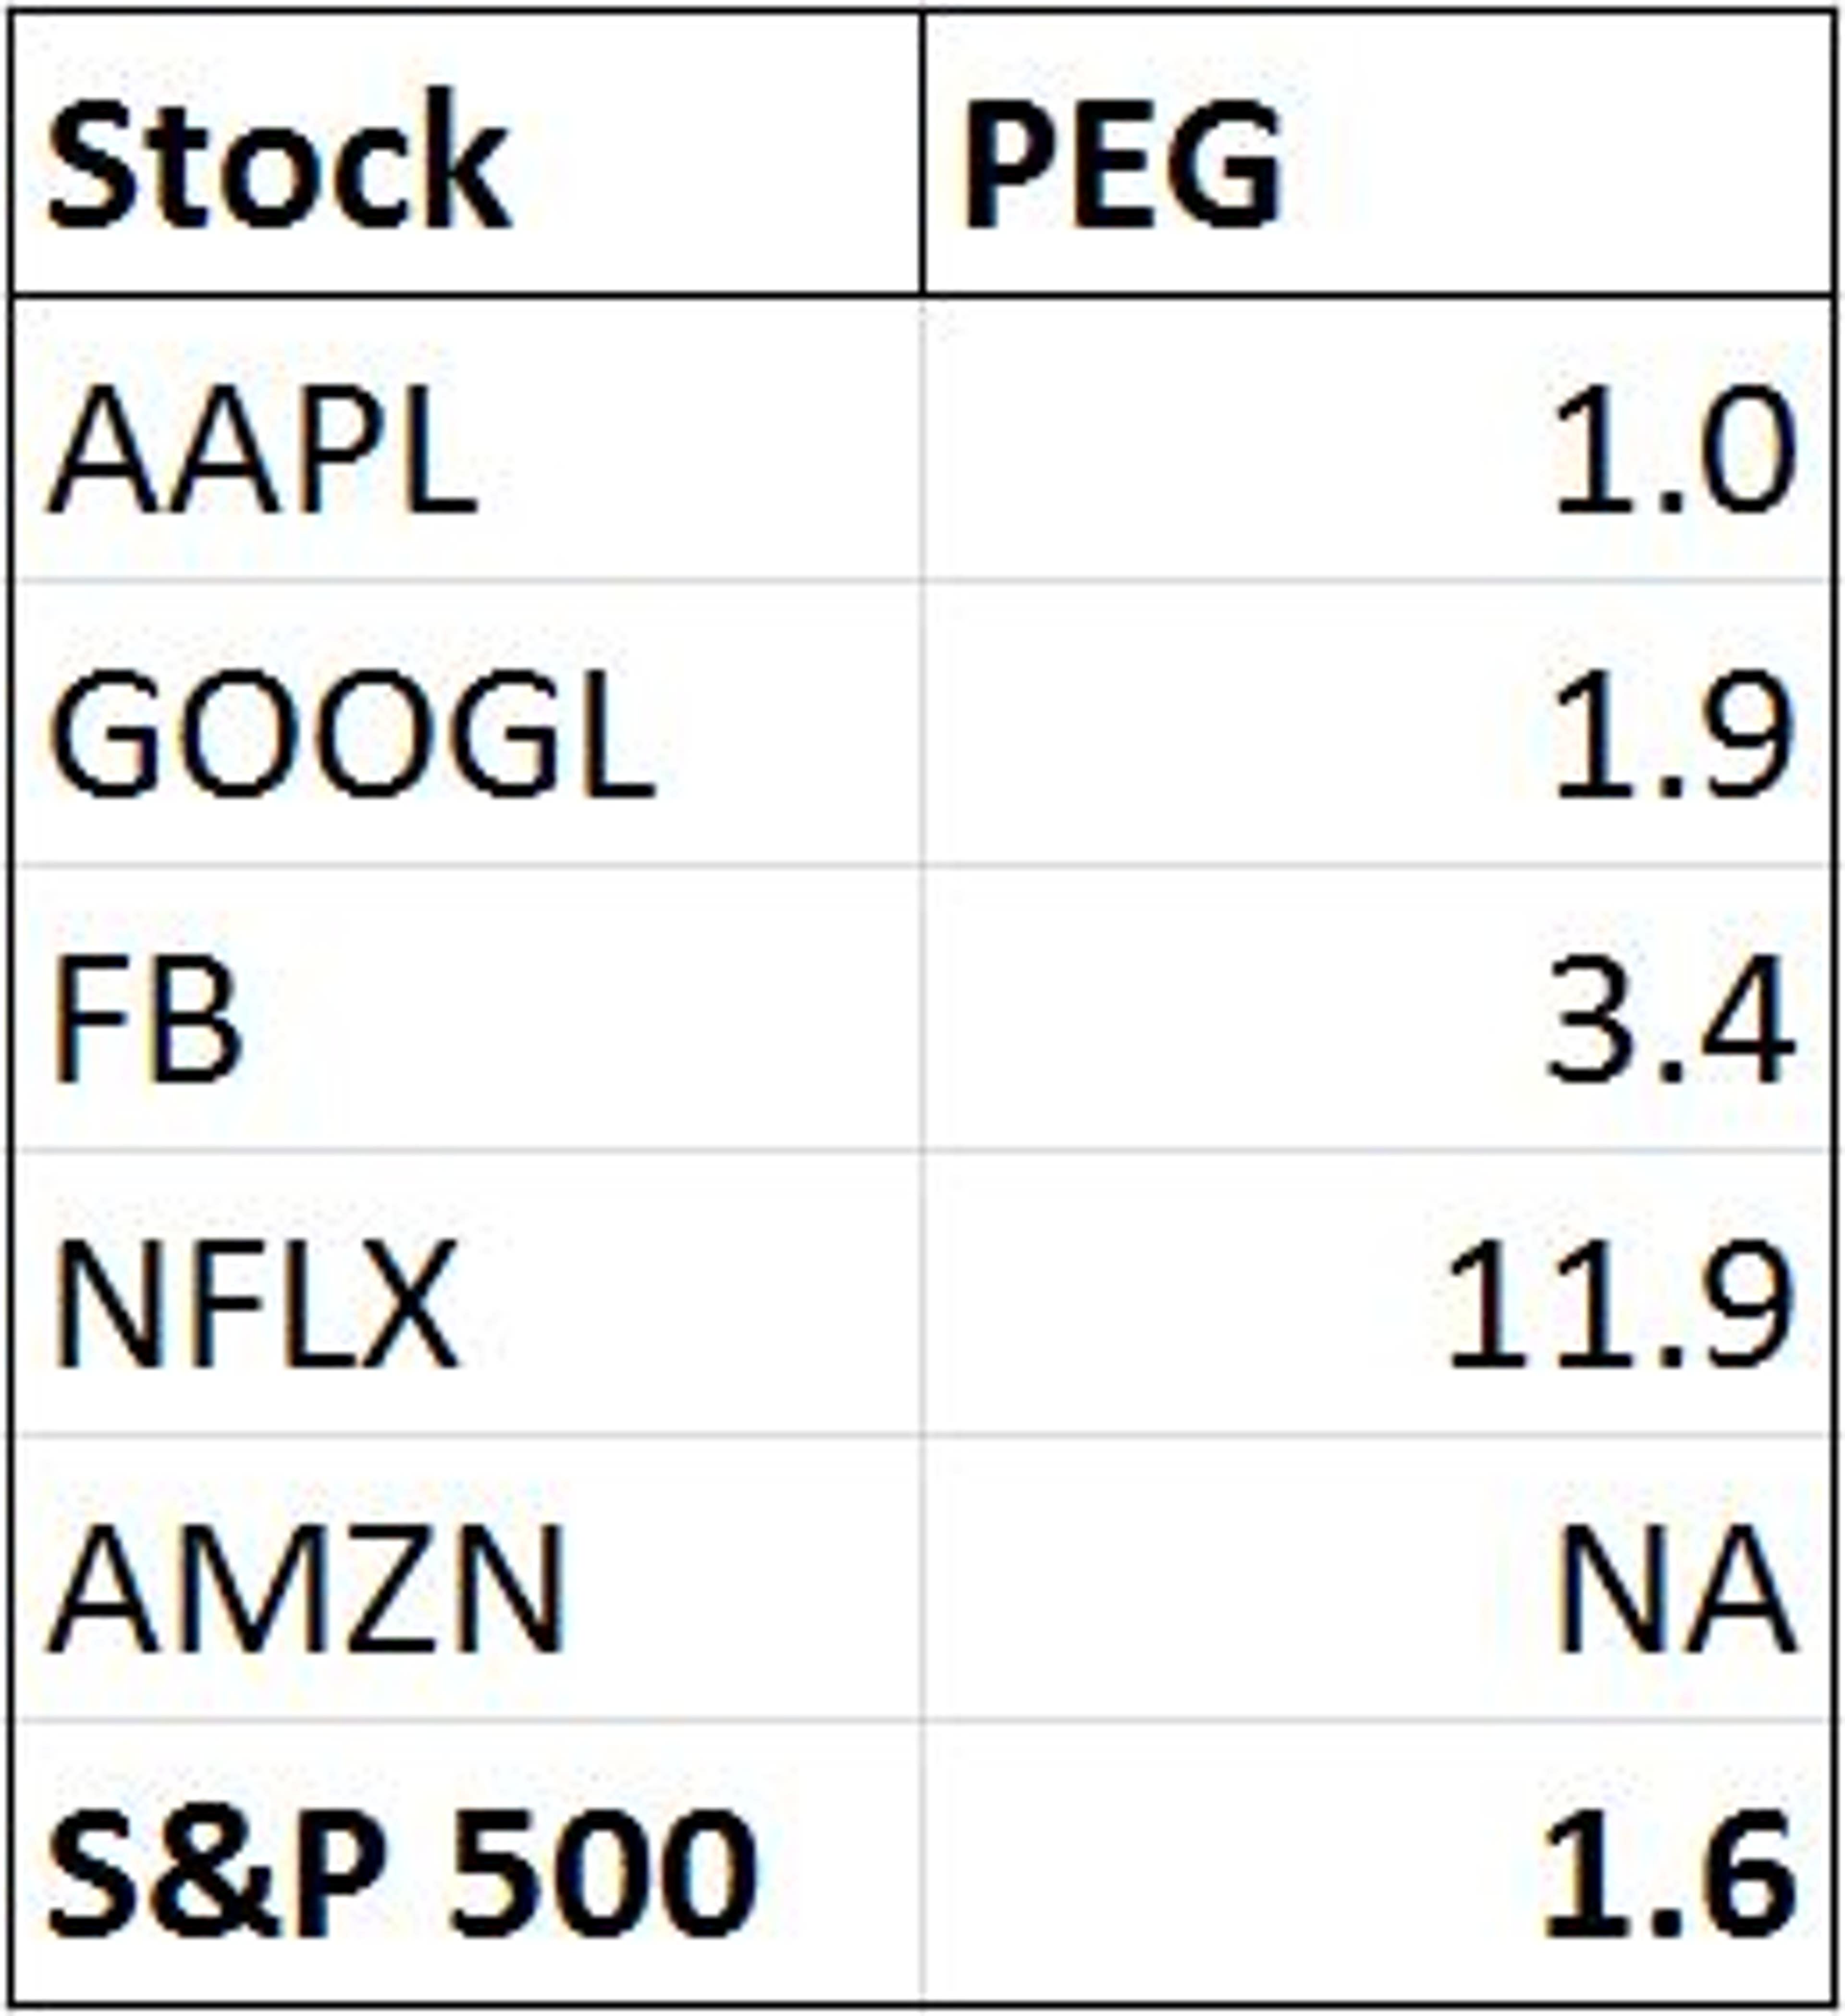
Again, Apple is the only stock with a PEG lower than the overall S&P 500. Google’s 1.9 PEG is relatively high, and Facebook and Netflix’s PEGs are more than double the S&P 500 average. Once again, Amazon’s negative earnings do not allow for a PEG calculation.
Cash Flow
Finally, when a company reinvests a large portion of earnings back into the company for the purpose of expanding operations and growing the business, earnings numbers aren’t the best measure of a company’s performance or a stock’s value.
Instead, investors may choose to focus on cash flow from operations, which indicates how much cash a company generates from regular business activities. Take a look at the price-to-cash-flow-from-operations ratio for each of these five companies.
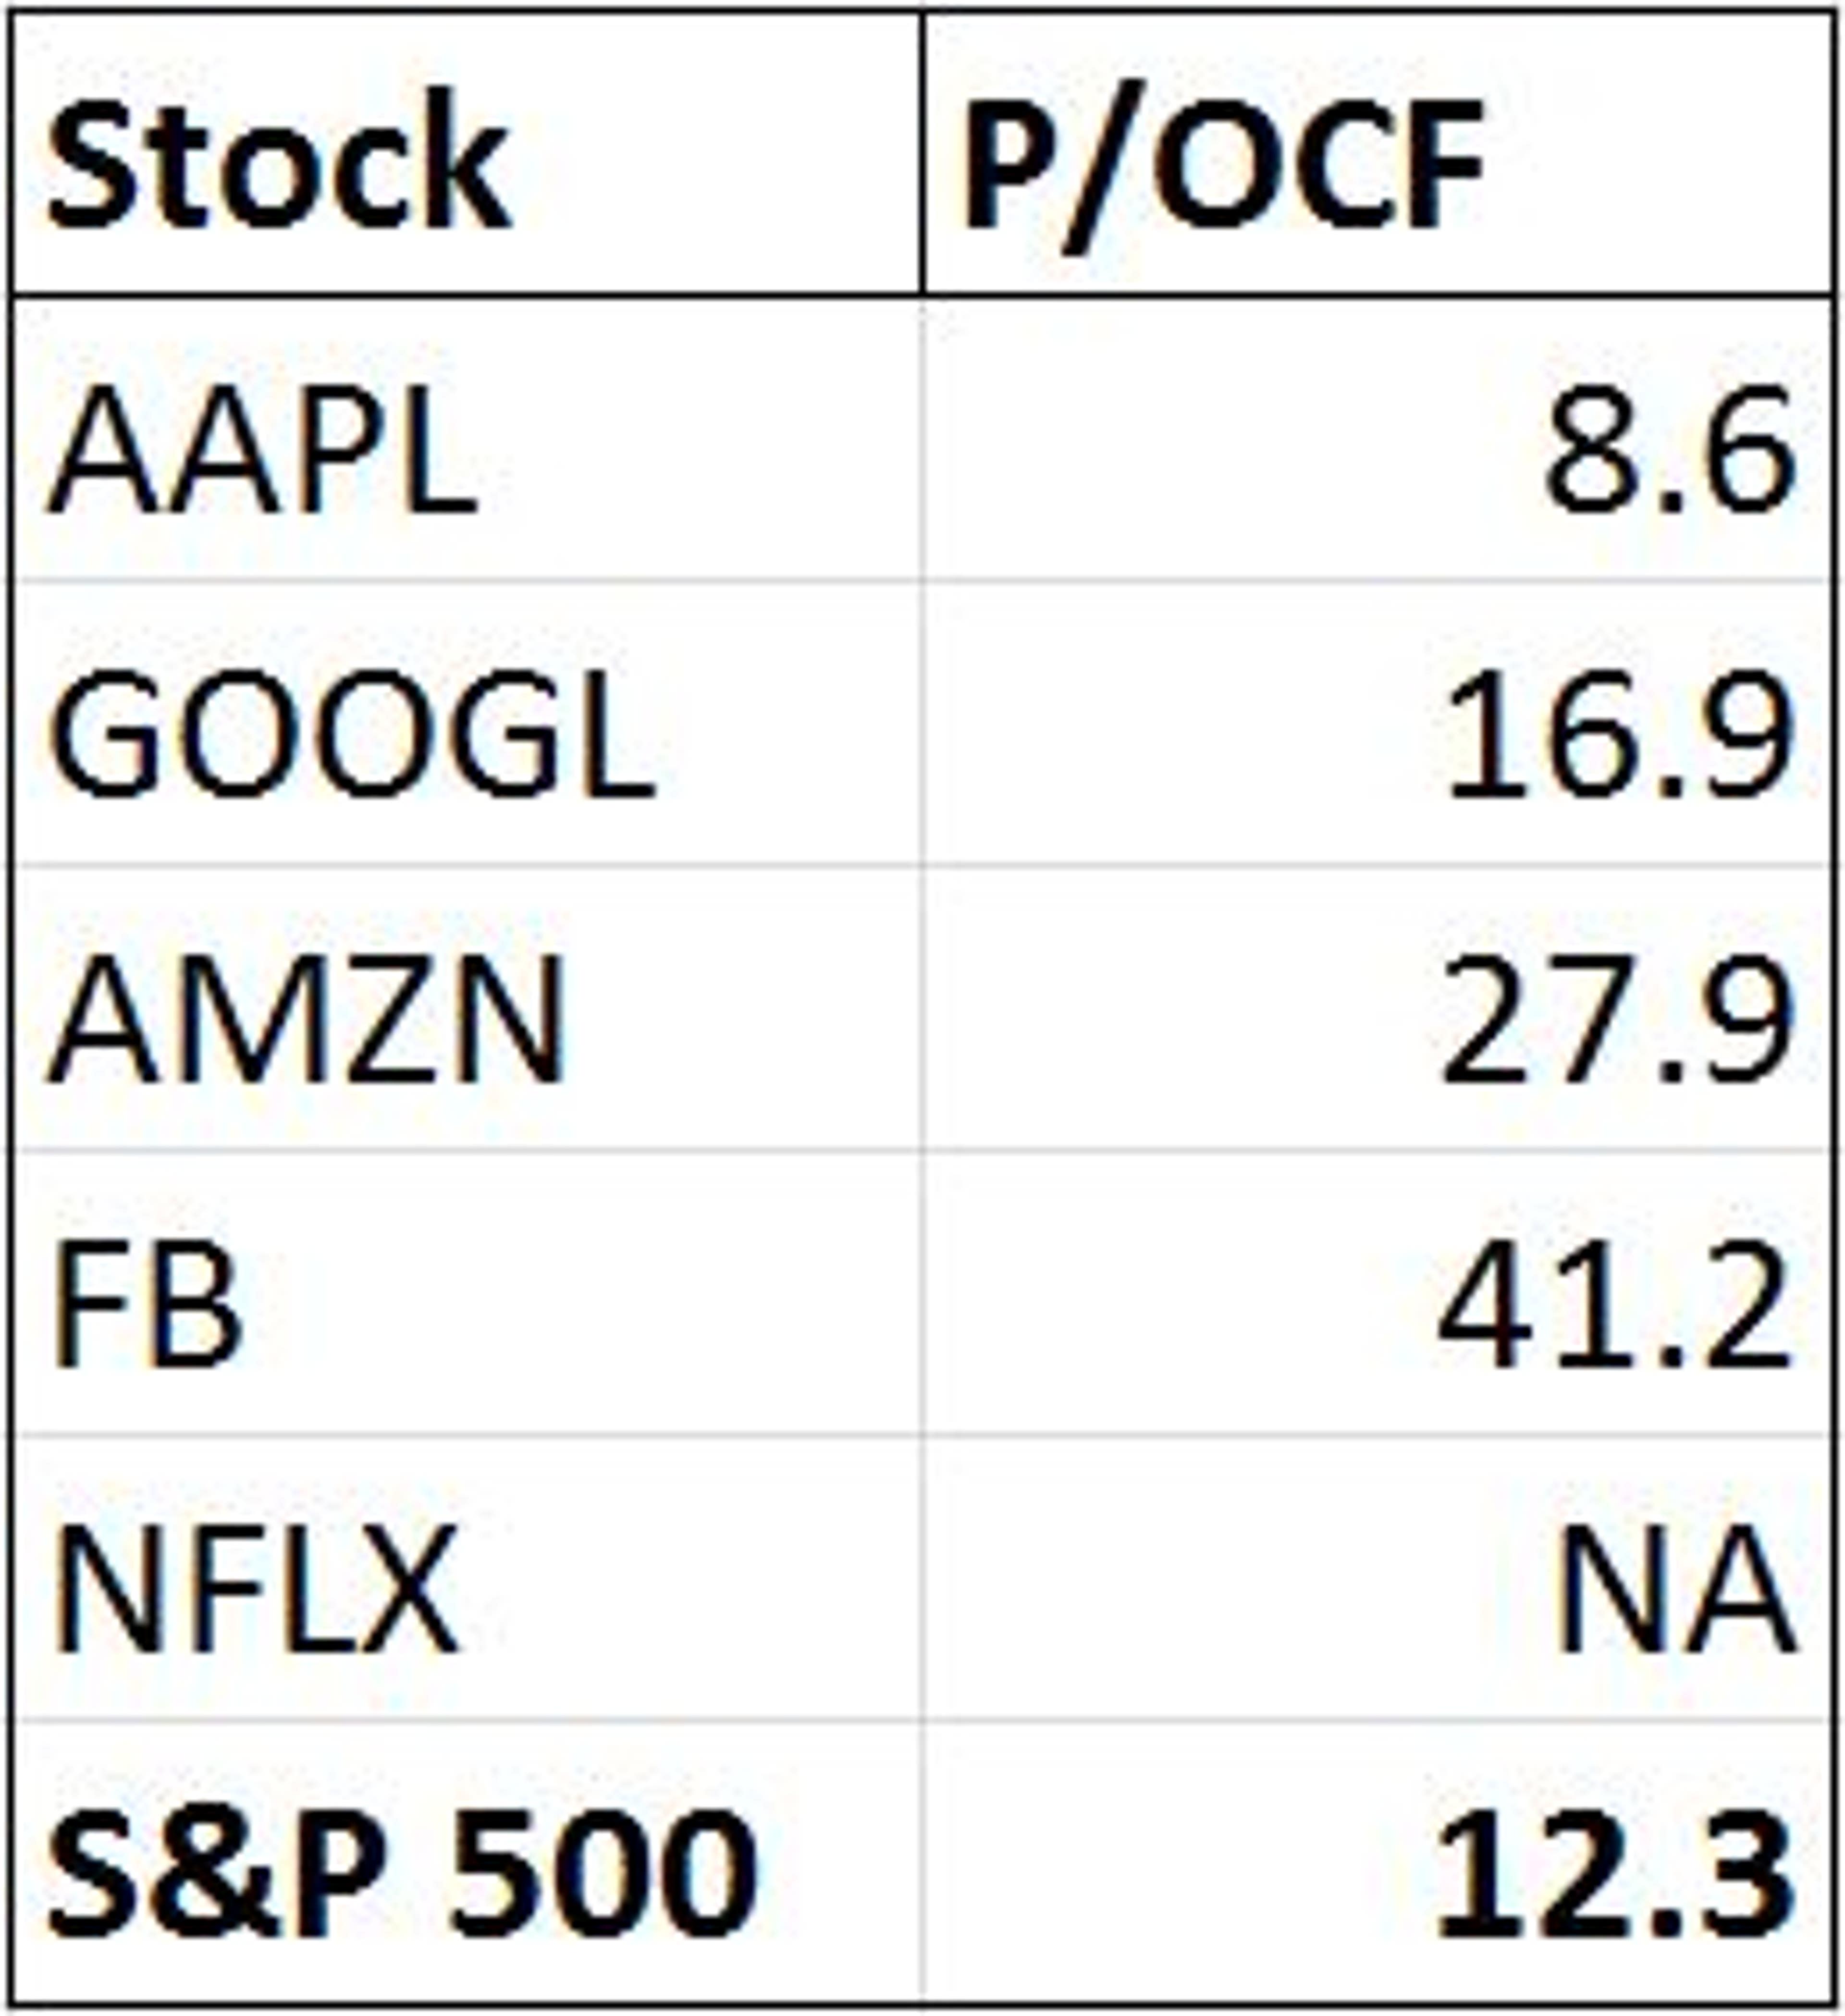
Once again, from a value perspective, Apple comes out on top as the only stock that beats the S&P 500 average. Google’s ratio is above average, but Amazon and Facebook’s P/OCF are substantially more than twice the S&P 500 average. Netflix has generated negative operating cash flow during the past four quarters.
Takeaway
While Apple shareholders may be concerned about the recent dip in share price, the stock's falling price only adds to its appeal from a value perspective. Shareholders of Amazon and Netflix, on the other hand, must hope that the market continues to reward the companies' growth despite extremely high valuations compared to peers.
Image Credit: Public Domain© 2024 Benzinga.com. Benzinga does not provide investment advice. All rights reserved.
Trade confidently with insights and alerts from analyst ratings, free reports and breaking news that affects the stocks you care about.

