


Trade of the Day
Long
Matador Resources Co (MTDR)
Wednesday, June 4, 2014
The Trade:
Despite stumbling out of the gate in January to start the year, Oil & Gas Exploration & Production stocks have had a great half year. Since February, the SPDR S&P Oil & Gas Exploration & Production ETF (XOP) has been in a healthy up-trend, while many constituents in the sub-industry have really been taking off FANG CRZO, XEC). This afternoon, Matador Resources Co (MTDR) offers a nice opportunity to buy an explosive stock in a thriving sub-industry at a relatively good entry point.
MTDR isn't quite the rocket ship up-trend that the above-mentioned stocks are. However, if you take a quick glance at the return figures, you'd see that the stock has gone from $8 at the beginning of 2013 to recent highs just south of $29. That's +262% in a year and a half, so there is certainly explosive potential here.
The thing I like about MTDR is that despite this large return, the stock consolidates often. Since last summer, nearly every short-term push to new highs has been met with a significant period of consolidation, usually lasting 2-4 weeks. This is encouraging, as it shows traders are constantly working out where MTDR should be priced rather than jumping on the momentum train.
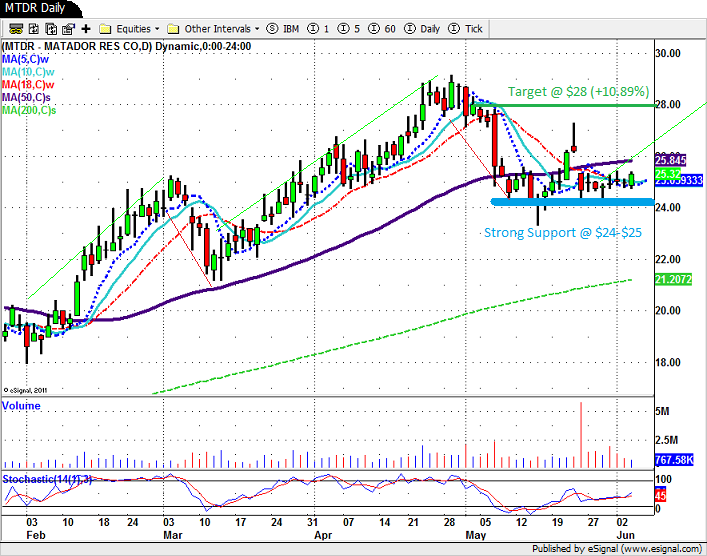
Even with the pull-backs to test runs higher, MTDR has consistently made higher highs and higher lows for quite some time, which makes this trade pretty easy. Currently, MTDR has pulled back from late-April highs just south of $29 to the $24-$25 area. It has formed a solid base at this price range over the past 3 weeks, and recent price action suggests that the next move is another leg up to push new all-time-highs.
There is some recent upward momentum in the XOP, and MTDR should follow suit if it can hold here. It looks to be doing so this afternoon and is sitting at a pretty good buy point. Analysts at Sidoti have MTDR rated "buy", while BMO Capital has it as "market perform" with a target of $28. This works out nicely, as $28 is the next resistance test for MTDR, and is the target for this set-up.
From current prices, a run up to $28 would produce a gain of +10.89%. Our stop would be at $24, right at the low end of support. This makes the potential loss of this trade -4.95% should we get stopped out. Thus, the potential gain outweighs the potential loss by a ratio of about 2 : 1.
The move in Oil & Gas Exploration & Production stocks is still alive, though it's difficult to find a stock to get into that's not straight up. MTDR could be the answer, and its healthy technical set-up and favorable entry point scream buy this afternoon for those looking for a clear-cut swing trade this week.
Entry Method:
Buy at the current price (~$25.25).
Exit Method:
Sell at a close below $24.00 (Breakdown) / An intraday price of $28.00 or above (Profit-Taking)
Company Profile:
Matador Resources Company is an independent energy company engaged in the exploration, development, production and acquisition of oil and natural gas resources in the United States, with an emphasis on oil and natural gas shale and other unconventional plays. Its operations are focused primarily on the oil and liquids-rich portion of the Eagle Ford shale play in South Texas and the Wolfcamp and Bone Spring plays in the Permian Basin in Southeast New Mexico and West Texas. The Company also operates in the Haynesville shale and Cotton Valley plays in Northwest Louisiana and East Texas. In addition, it has a large exploratory leasehold position in Southwest Wyoming and adjacent areas of Utah and Idaho where it is testing the Meade Peak shale.
Stock Rating:
The Stock Rating indicates the combined score of our proprietary Earning Strength and Company Performance models. The rating scale is 0 - 10 with 10 being the highest.
Disclosure:
At the time of publication the editor and affiliated companies own the following positions:
None
Note: Positions may be bought or sold while this publication is in circulation without notice.
Looking for Additional Guidance in the Markets?
StateoftheMarkets.com offers actionable portfolio services designed to help you manage your investment portfolio.
The Daily Decision: A disciplined approach to managing stock market risk on a daily basis. Forget the fast money and the latest, greatest option trade. Investors first need is a strategy to keep them "in" the stock market during bull markets and on the sidelines (or short) during bear markets. The Daily Decision system was up 30.3% in 2012, finished 2013 +44.3%, and the system sports an average compound rate of return of more than 30% per year.
The Insiders Portfolio: A truly unique approach to stock picking. This portfolio buys what those who know their company's best are buying - but ONLY when they are buying heavily. The Insiders finished 2013 +47.25% and has nearly doubled the S&P 500 since 2009.
The IRA/401K Advisor: Stop ignoring your 401K! Long-term oriented service designed for IRAs and 401Ks - The IRA-401K Advisor. This portfolio strives to keep retirement accounts positioned on the right side of the markets, and at an extremely low price, it is a service you really can't afford not to use while planning for retirement.
All StateoftheMarkets.com Premium Services include a 30-day money-back guarantee.
The analysis and information in this report and on our website is for informational purposes only. No part of the material presented in this report or on our websites is intended as an investment recommendation or investment advice. Neither the information nor any opinion expressed nor any Portfolio constitutes a solicitation to purchase or sell securities or any investment program. The opinions and forecasts expressed are those of the editors of StateoftheMarkets.com and may not actually come to pass. The opinions and viewpoints regarding the future of the markets should not be construed as recommendations of any specific security nor specific investment advice. Stocks should always consult an investment professional before making any investment.
Any investment decisions must in all cases be made by the reader or by his or her investment adviser. Do NOT ever purchase any security without doing sufficient research. There is no guarantee that the investment objectives outlined will actually come to pass. All opinions expressed herein are subject to change without notice. Neither the editor, employees, nor any of their affiliates shall have any liability for any loss sustained by anyone who has relied on the information provided.
The analysis provided is based on both technical and fundamental research and is provided 'as is' without warranty of any kind, either expressed or implied. Although the information contained is derived from sources which are believed to be reliable, they cannot be guaranteed.
The information contained in our websites and StateoftheMarkets.com publications is provided by Ridge Publishing Co. Inc. (Ridge). One of the principals of Ridge, Mr. David Moenning, is also President and majority shareholder of Heritage Capital Management, Inc. (HCM) a Chicago-based money management firm. HCM is registered as an investment adviser. HCM also serves as a sub-advisor to other investment advisory firms. Ridge is a publisher and has not registered as an investment adviser. Neither HCM nor Ridge is registered as a broker-dealer.
Employees and affiliates of HCM and Ridge may at times have positions in the securities referred to and may make purchases or sales of these securities while publications are in circulation. Editors will indicate whether they or HCM has a position in stocks or other securities mentioned in any publication. The disclosures will be accurate as of the time of publication and may change thereafter without notice.
Index returns are price only and do not include the reinvestment of dividends. The S&P 500 is a stock market index containing the stocks of 500 large-cap corporations, most of which are US companies. The index is the most notable of the many indices owned and maintained by Standard & Poor's, a division of McGraw-Hill. S&P 500 is used in reference not only to the index but also to the 500 companies that have their common stock included in the index.
Investments in equities carry an inherent element of risk including the potential for significant loss of principal. Past performance is not an indication of future results.
© 2014 StateoftheMarkets.com - StateoftheMarkets.com does not provide investment advice. All rights reserved.
© 2024 Benzinga.com. Benzinga does not provide investment advice. All rights reserved.
Trade confidently with insights and alerts from analyst ratings, free reports and breaking news that affects the stocks you care about.

