


Veru Inc VERU shot up 235% at one point on Monday before closing the trading session up more than 180% off Friday’s closing price. On Tuesday, the stock was consolidating the move higher by setting up an inside bar pattern on the daily chart.
On Monday, Veru announced the results for its Phase 3 study of its COVID-19 drug, Sabizabulin, which showed the drug cut the deaths of 55% of hospitalized patients at risk for Acute Respiratory Distress Syndrome. The oncology biopharmaceutical company plans to file an emergency use authorization application with the FDA.
Analysts reacted positively to the news by raising their price targets for the stock on Tuesday. HC Wainwright & Co. maintained a Buy on Veru and raised the price target to $24, while Oppenheimer maintained its Outperform rating on the stock and upped the price target to $36.
If Veru were to reach the lowest of the two price targets it would still represent an increase of about 138% from the current share price, which the stock could reach if it breaks up from a bullish pattern developing on the daily chart after a period of consolidation takes place.
When a stock moves in either direction too quickly, profit takers come in, which usually results in a period of consolidation before a continuation move or a reversal takes place. Although Veru looks set to soar higher still, the stock may need to cool down a number of indicators before bullish traders who are not currently in a position feel comfortable enough to buy back in.
Want direct analysis? Find me in the BZ Pro lounge! Click here for a free trial.
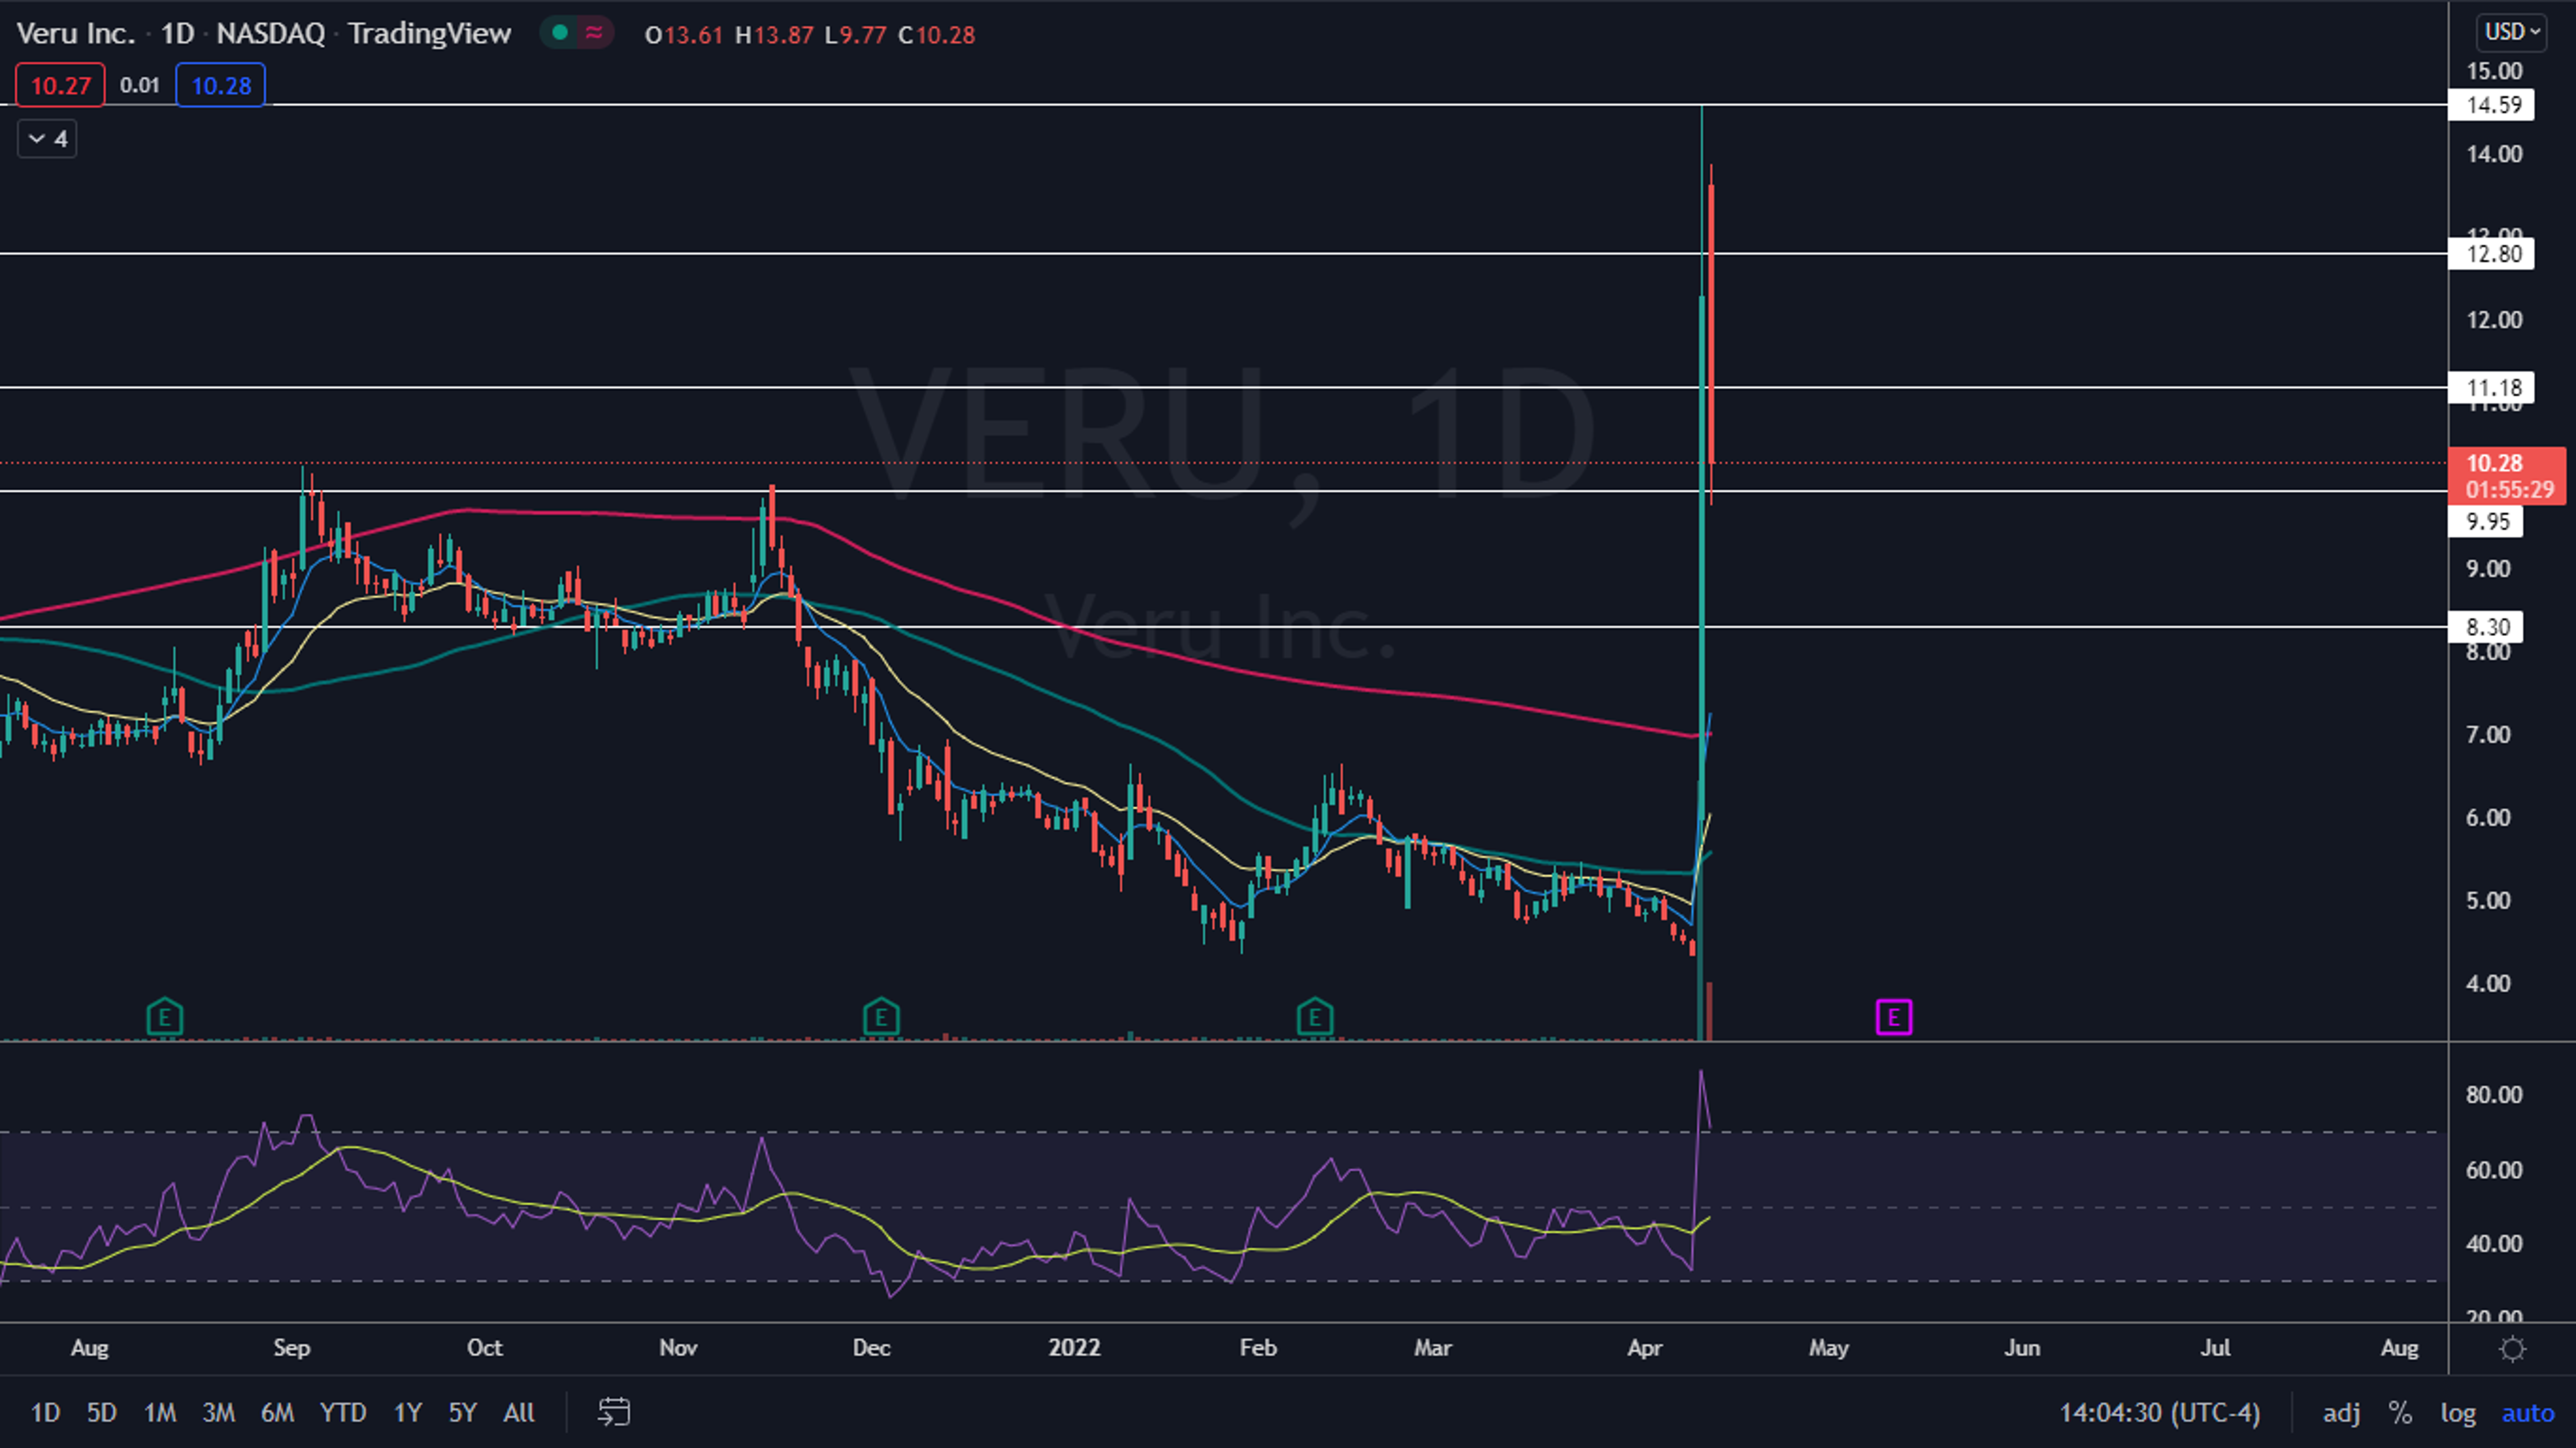
The Veru Chart: On Tuesday, Veru opened higher but ran into sellers and profit takers, which helped to drop the stock down about 17% by midafternoon. The price action was completely within Monday’s range, however, which has caused an inside bar to develop on the daily chart. The inside bar leans bullish because the stock was trading higher before forming the pattern.
- The surge higher caused Veru to become extended from the eight-day and 21-day exponential moving averages (EMs) as well as the 50-day and 200-day simple moving averages (SMAs), which indicates a longer period of consolidation may be needed. If Veru is able to trade up above the 200-day SMA for a period of time, the 50-day SMA will cross back above the 200-day, which will create a golden cross on the chart.
- Traders and investors can watch for one or more inside bars to continue to develop between Monday’s trading range while the moving averages trend higher to catch up to the share price. Traders looking to take a position may choose to wait for a break up or down from Monday’s mother bar to gauge future direction.
- If Veru continues to develop a series of inside bars, traders and investors can watch for the volume to taper off, which could indicate the stock is running out of both buyers and sellers as it powers for another move higher.
- On Tuesday, Veru was trading on higher-than-average volume, with more than 76 million shares having exchanged hands by midafternoon compared to the 10-day average of 42.59 million, which indicates a large number of sellers have exited their positions.
- Veru has resistance above at $11.18 and $12.80 and support below at $9.95 and $8.30.

© 2024 Benzinga.com. Benzinga does not provide investment advice. All rights reserved.
Trade confidently with insights and alerts from analyst ratings, free reports and breaking news that affects the stocks you care about.

